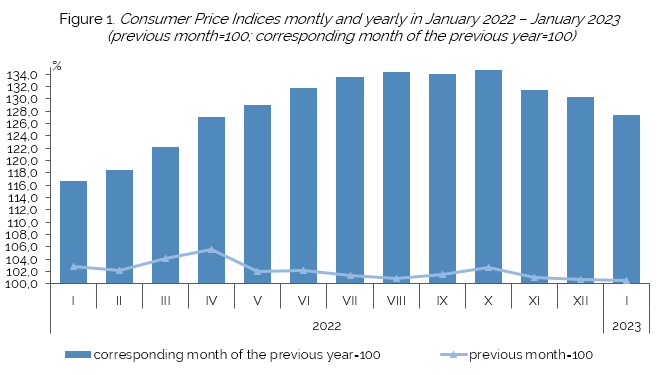
The National Bureau of Statistics informs that average consumer prices in January 2023 compared to December 2022 increased by about 0,5% (compared to 2,8% in the same month of 2022). The increase in average consumer prices was determined by the increase in prices of:
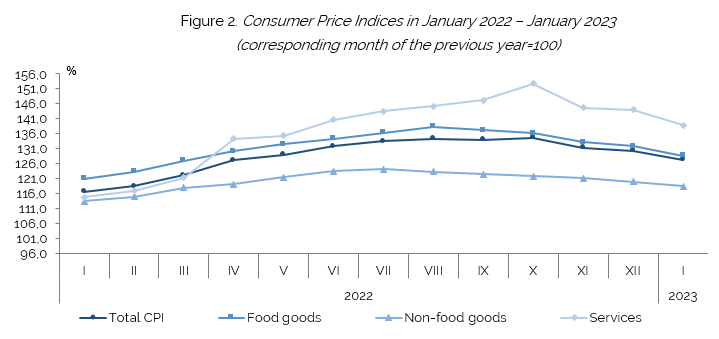
- food by 1,1%, contributing to the increase in average consumer prices by about 0,4%,
- non-food goods by 0,5%, contributing to the increase in average consumer prices by 0,2%.
At the same time, prices of services provided to the population in January 2023 decreased on average by 0,7%, contributing to the attenuation of the increase in average consumer prices by about 0,2%.
Table 1. Inflation rate in December 2022
Consumer goods and services | Weights of expenditure groups (by decimals | January 2023, in % compared to: | Contribution on the overall change in consumer price | |
December 2022 | January 2022 | |||
Total CPI | 10000 | 0,45 | 27,31 | 0,45 |
Food goods | 3669 | 1,12 | 28,59 | 0,41 |
Non-food goods | 3932 | 0,52 | 18,44 | 0,20 |
Services | 2399 | -0,69 | 38,86 | -0,17 |

Table 2. Consumer price indices in December 2022, by divisions of consumer goods and services, according to COICOP
Division | Specification | Weights of expenditure groups (by decimals) | January 2023, in % compared to: | Contribution on the overall change in consumer price in January 2023 compared with the December 2022 | |
December 2022 | January 2022 | ||||
| Total CPI | 10000 | 100,45 | 127,31 | 0,45 |
01 | Food and non-alcoholic beverages | 3504 | 101,13 | 129,09 | 0,40 |
02 | Alcoholic beverages and tobacco | 355 | 103,68 | 118,50 | 0,13 |
03 | Clothing and footwear | 887 | 100,10 | 112,46 | 0,01 |
04 | Housing, water, electricity, gas and other fuels | 1190 | 98,96 | 166,03 | -0,12 |
05 | Furnishings, household equipment and routine household maintenance | 864 | 100,34 | 118,48 | 0,03 |
06 | Health | 728 | 99,08 | 106,89 | -0,07 |
07 | Transport | 996 | 101,07 | 134,49 | 0,11 |
08 | Communication | 452 | 99,96 | 104,97 | 0,00 |
09 | Recreation and culture | 274 | 95,83 | 113,89 | -0,11 |
10 | Education | 116 | 102,17 | 124,86 | 0,03 |
11 | Restaurants and hotels | 278 | 100,69 | 123,83 | 0,02 |
12 | Miscellaneous goods and services | 357 | 101,18 | 118,14 | 0,04 |

Annual inflation
Average consumer prices in January 2023 compared to January 2022 ( in the last 12 months) increased by 27,3%, including food by 28,6%, non-food goods by 18,4% and household services by 38,9%.
More detailed information is available in Romanian language.

