
Launch of the new animated graphs in labour force statistics field

 Starting today, March 19, 2012 National Bureau of Statistics offers animated graphs in labour force statistics field to data users.
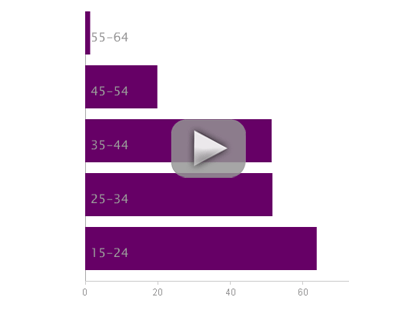
Animated data visualisation using this application presents the changes in quarterly unemployment rate and labour force migration, by age groups, from 2000 to the present.
Applications were developed in collaboration with Data Visualisation Centre of United Kingdom’s Office for National Statistics.
The animated graphs can be accessed from the main page or under the heading Statistical data / Labour force.
Share

- Report a mistake. Select the desired text and press CTRL + ENTER