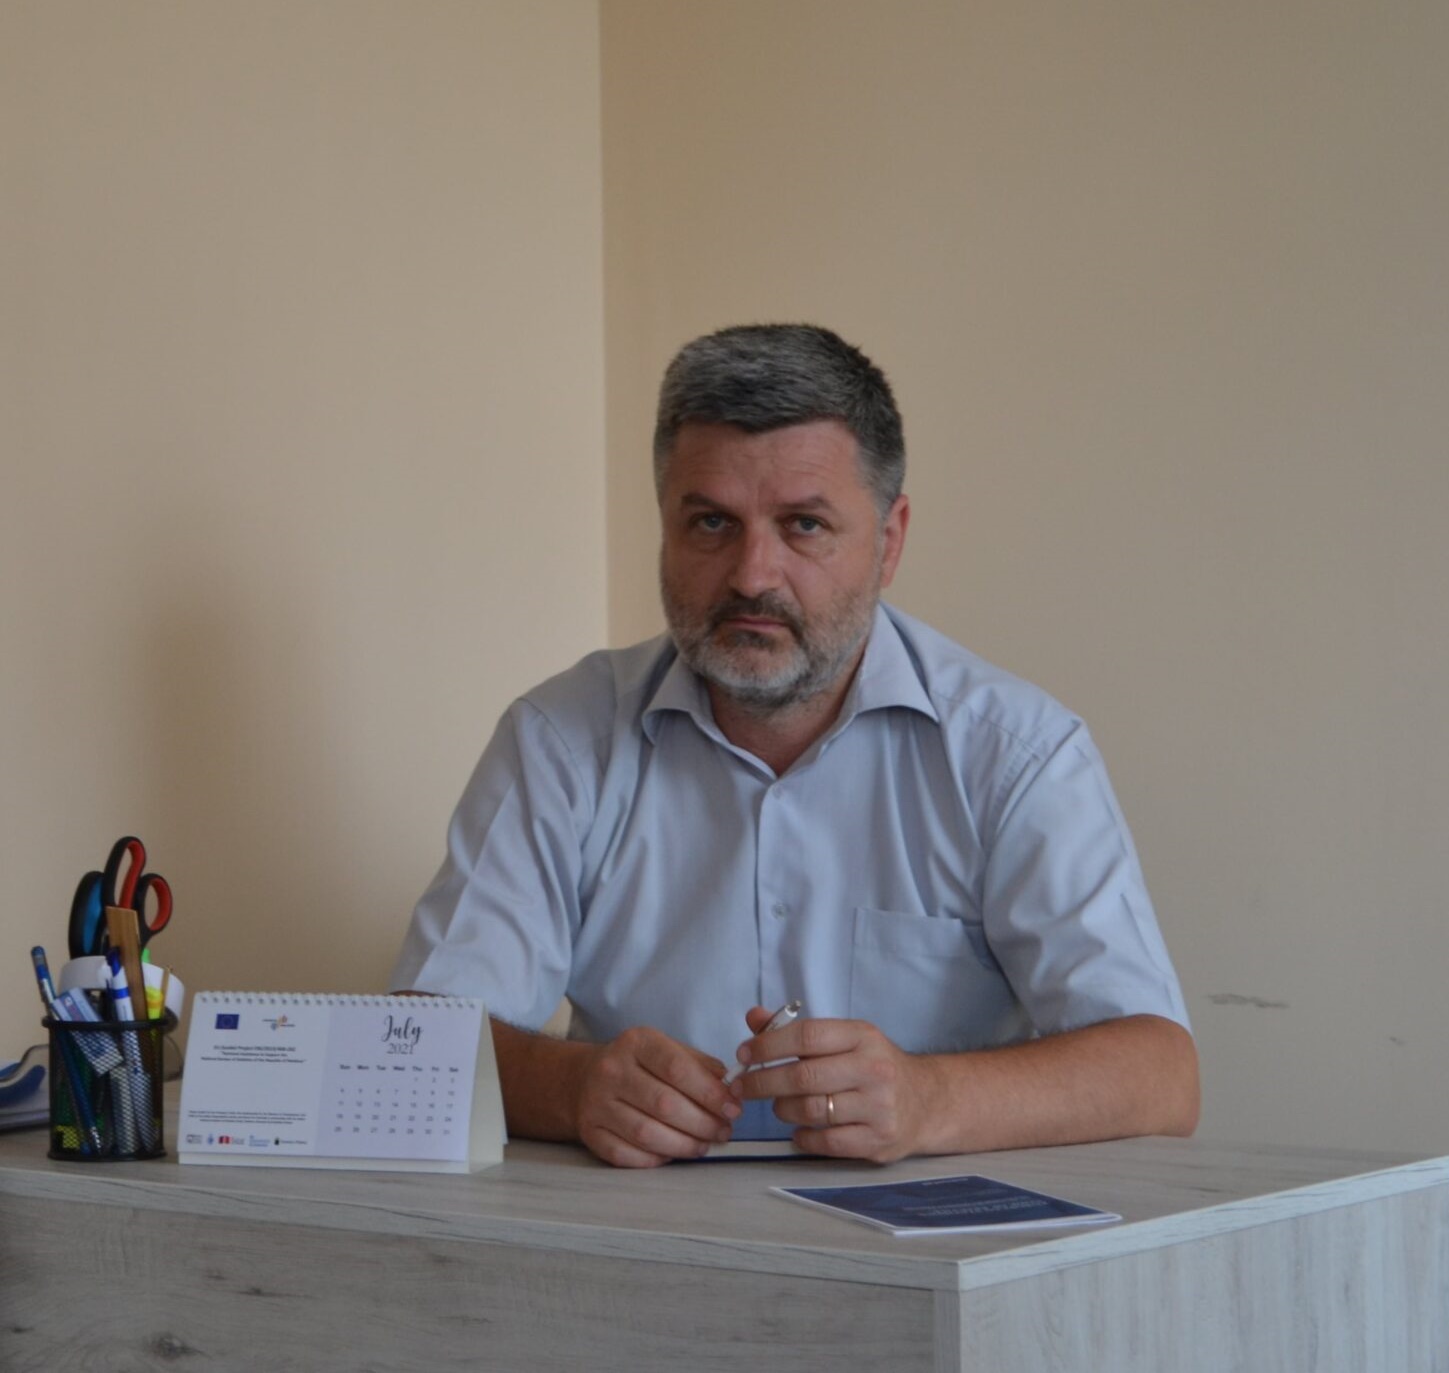
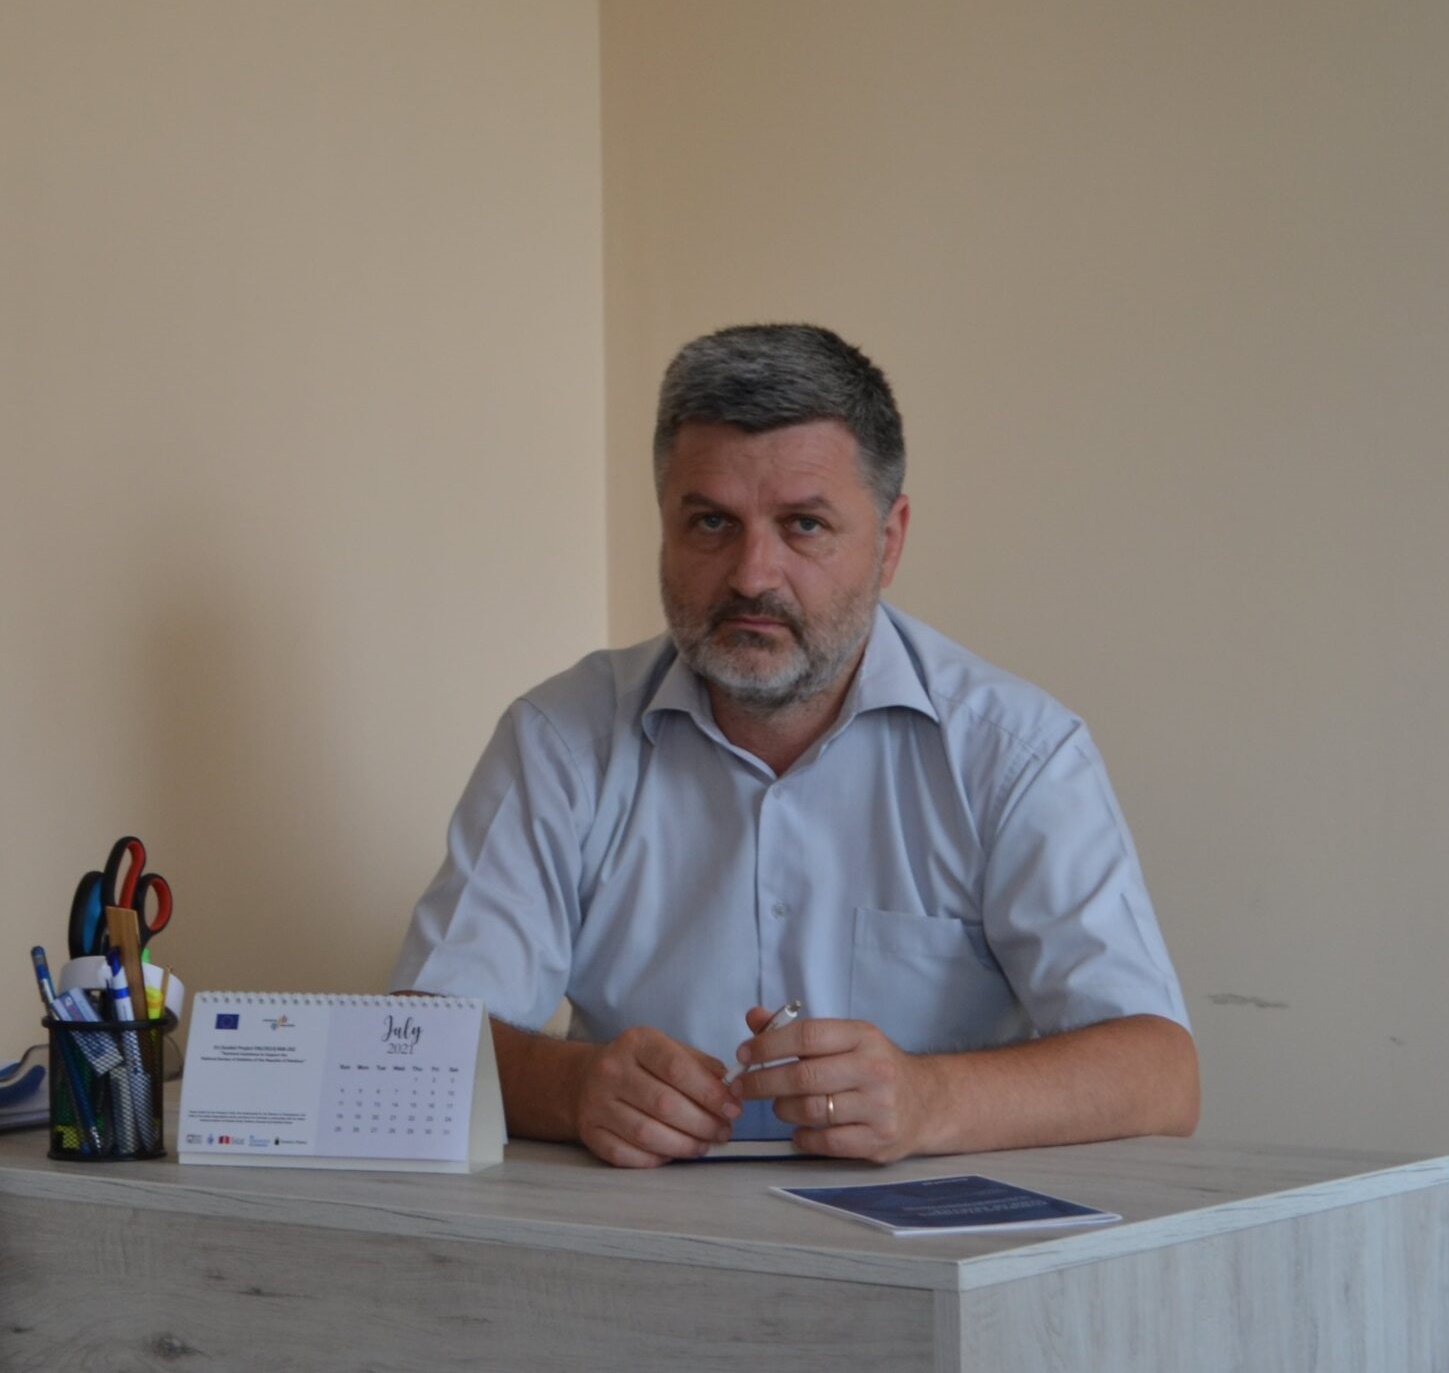
Lilian Galer: "The use of geospatial data and GIS tools at the NBS will allow Moldova
to produce and disseminate statistics integrated to locations”

Starting with the mid-June, 48 field operators are collecting data to update the digital maps of the Republic of Moldova, contributing to the creation of a statistical geodatabase at the National Bureau of Statistics (NBS). The data collected will serve as grounds for the preparing the next Population and Housing Census, as well as for other statistical surveys carried out by the NBS. Lilian Galer, head of the Statistical Methods Directorate, explains the long-term benefits and the essential role of the use of geospatial data and Geographic Information System (GIS) tools for the production of national official statistics and data dissemination as well.
Why is important to understand what the geospatial data and GIS tools represent?
GIS is a system that helps integrating statistical data with geospatial data, which represent geographic locations. As statisticians, we operate with a considerable amount of information and usually disseminate using tables, graphs or other tools, while the GIS tools help us to present the data on a map. In short terms, GIS is a database, where each record has a geographical coordinate associated, so therefore the statistical variables are associated to geographic locations.
The GIS is an essential component to ensure the quality and smooth running of the next Population and Housing Census and other statistical surveys. Can you explain the role of using GIS tools in such surveys?
That's right. During the previous census the use of GIS was at an initial phase of development, so that we used only paper-based maps that made difficult sometimes to count people and housing units. For the next Population and Housing Census, NBS aims to collect from the field data directly in electronic format with tablets, with geographic coordinates. So, the collected data will be sent almost in real time from the field to the NBS server. As a consequence, census data will not have to be entered manually in the server as done for the previous census: it will be available after some months and it is expected to have good quality. Also, the data collection via the GIS system and mobile devices will allow us to monitor in real time the way the operator collects the data. GIS and mobile data collection ensures quality, because it allow to check how enumerators perform in the field, and helps ensuring the full coverage of people and housing units.
The NBS carries out several activities to prepare the functionality of the GIS. At what stage are you now?
At present, we are collecting geospatial data in the areas of the countries where the available cadastral data managed by the Land Relations and Cadastre Agency and Public Services Agency is not complete. 48 operators are collecting data about buildings, their conditions and their use, for instance if they are used for residential or non-residential purposes. There is also a team of Supervisors who monitor in real time the quality of the collected data. Actually, the ongoing map updating activities are the first phase of a medium-to long-term strategy, which should integrate GIS and geospatial data into the standard processes for producing official statistics. The goal is to develop a statistical register of buildings and dwellings that will also include geocoding of business units.
NBS is assisted by a team of international experts providing technical support. What is the European Union's contribution to this important work?
The NBS undertook the first attempts to implement the GIS technology early in the 2016-2017. Then, with the support of development partners, we decided to geo-reference the boundaries of the census sectors. However, in addition to capacities and skills, GIS also requires substantial financial resources. The EU project "Technical assistance to Support the National Bureau of Statistics of the Republic of Moldova" developed for us a specific application named FieldMapstat, which with the help of European GIS experts, we adapted to our needs. It is based on the latest worldwide available technologies in this sector.
Since the GIS will also improve the way of disseminating the data, how will the statistical data users benefit from this?
First, the users will access the statistical data in a much more attractive way, looking at the statistical data through thematic maps or story maps. Secondly, users will have the possibility to access a statistical geoportal, where it will be possible to select a specific region or municipality, or locality on the map, and to access its corresponding data. Such geoportal will also be useful for public authorities especially for planning the delivery of social services: for example, if the local authority wants to open a kindergarten, it will be possible to see immediately who lives in that area, how many children there are, women, men, elderly people. Depending on these indicators, public authorities will be able to make decisions based on official statistical data.
Why a map with necessary data is more informative than a table, for instance?
It's more informative, but also more interactive, as I said before. With the help of GIS we can get new information, we can even predict future patterns. For example, there are sustainable development indicators (SDGs) on the access to drinking water sources or access of the population within 2 km to a all-seasons roads. This kind of data can be provided exclusively through GIS system, because the number of the population living or not living near the road or near a safe source of drinking water can be easily identified on a map. I can hardly imagine how this data could be visualised and extracted from a table, for example. The benefits and opportunities that GIS tools can provide are extremely valuable in statistics since they provide advantages for both data providers and data users.
This interview was given within the project “Technical Assistance to Support the National Bureau of Statistics of the Republic of Moldova” and published on the website parstat.md.

