
The National Bureau of Statistics presents the final results of the 2024 Population and Housing Census (PHC) on the demographic characteristics of the population with usual residence2 on the census reference date (April 8, 2024).
According to the final results of RPL 2024, compared to 2014 PHC:
- The female population accounted for 52.8% of the country's population, up 0.8 percentage points (p.p.) from 2014 PHC (52,0%);
- For every 100 women, there were 89 men, compared to 92 men for every 100 women in 2014;
- The average age of the population at the 2024 census was 40.6 years, or 3.1 years older than at the 2014 census (37.5 years);
- Socio-demographic Index was 79 elderly people unable to work per 100 elderly people able to work, compared to 62 people in the 2014 census;
- The share of the population who had their usual residence (lived) in the same locality where they were born was 65.1%;
- Of the total population with usual residence, 2,383,100 persons or 98.9% held Moldovan citizenship, including citizenship of another state, down by 0.6 percentage points compared to the 2014 census;
- Depending on the country of birth, the absolute majority of the country's population, 2,301,000 people (or 95.5%), were born in the Republic of Moldova, and 106,700 people (or 4.4%) were born in other countries.
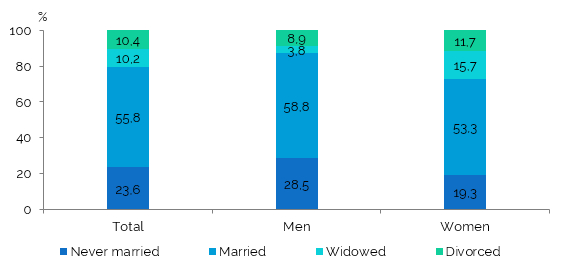
- Married persons accounted for 55.8% of the total population aged 15 and over (compared to 57.4% in 2014), never married persons accounted for 23.6% (24.6%), widowed persons for 10.2% (12.2%), and divorced persons for 10.4% (5.8%);
- The share of women who gave birth to two or three children increased by 5.4 percentage points (from 32.8% to 38.3%) and by 2 percentage points (from 13.4% to 15.4%), respectively, while the proportion of women who did not give birth decreased by 4.2 percentage points.
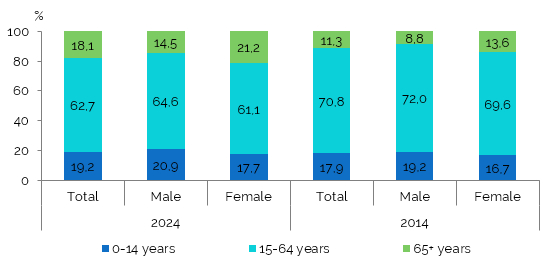
Population structure by age group and sex
According to the results of the 2024 PHC, on its reference date, the share of the population in the 0-14 age group was 19.2%, in the 15-64 age group - 62.7%, and in the 65 and over age group - 18.1% of the total population (Figure 1). The share of the male population aged 0-14 was 20.9%, and aged 15-64 - 64.6%, or 3.1 p.p. and 3.5 p.p. higher than the share of the female population of the same ages, and the share of men aged 65 and over (14.5%) was 6.7 p.p. lower than the share of women in this age group. In the age group 65 and over, the share of women was 62.0% (compared to 38.0% men) (Tables 2.1 and 2.2 in the Annex).
Figure 1. Population shares by age group and gender, in the 2024 and 2014 censuses, %
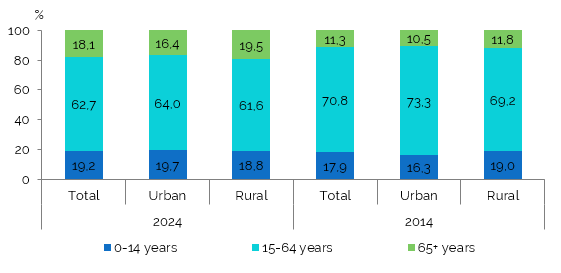
In urban areas, the share of the population aged 15-64 in the total population was 64.0% (compared to 73.3% in 2014), down by 9.3 p.p. In rural areas, there were 3.2 p.p. more people aged 65 and over than in urban areas (Table 2.2 in the Annex).
Compared to the 2014 census, the share of the population aged 15-64 decreased by 8.0 p.p. (from 70.8% to 62.7%), the share of the population aged 65 and over increased by 6.8 p. p. (from 11.3% to 18.1%) and that of the population aged 0-14 increased by 1.3 p.p. (from 17.9% to 19.2%), thus the process of population ageing is progressing (Figure 2).
Figure 2. Population shares by age group and place of residence, in the 2024 and 2014 censuses, %
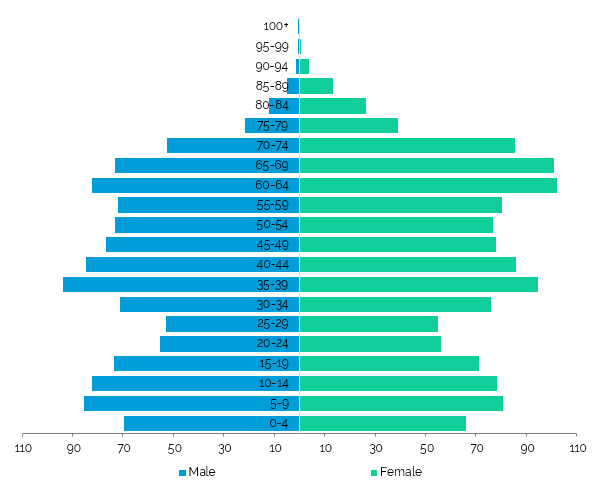
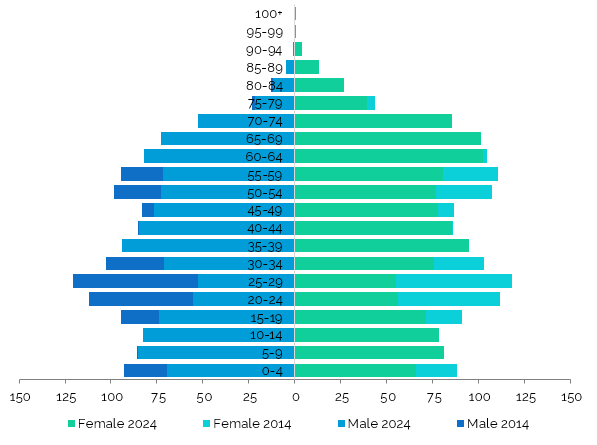
The smallest shares among children were those aged 0-3 (from 0.96 to 1.2% of the total population), among young people the least numerous were those aged 21-28 (each age group accounting for 0.8-0.9% of the total population), and among the adult population, the smallest share was among people aged 53-55 (1.2% for each age) (Figure 3). The 35-44 and 60-69 age groups were the most numerous, each accounting for 14.9%.
The sex structure of the population in the 2024 census shows that only in the category of children (0-17 years) was the proportion of boys higher than that of girls, as well as among young people aged 18, 19, and 21, while in the rest of the age categories the female population predominated. Men aged 35-44 accounted for 15.7% of the total male population, and women aged 60-69 accounted for 16% of the total female population.
Figure 3. Population pyramid at the 2024 census, thousands of people
The average age of the population at the 2024 census was 40.6 years, an increase of 3.1 years compared to the 2014 census. The discrepancy in average age by gender was 3.8 years (older women outnumbering older men) (Table 2.1 in the Annex), and the difference in average age by place of residence was 2.8 years, with urban residents having an average age of 39.1 years and rural residents having an average age of 42 years (Table 2.2 in the Annex).
Compared to 2014, the population decreased by approximately 13.6%, and the age structure of the population in the 2024 census revealed a 7.5 percentage point decrease in the proportion of young people aged 20-29, while the share of older people aged 60-69 increased by 4.6 p.p., with a more pronounced increase in rural areas - by 6.2 p.p. (Figure 4).
Thus, analyzing the population pyramid from the last two censuses, we can see a decrease in the proportion of children aged 0-6 and adults aged 45-60 by 20.8% and 20.5%, as well as a 38.5% decrease in the number of young people aged 15-35, with a more pronounced decrease in the 20-30 age group.
Figure 4. Population pyramid in the 2024 and 2014 censuses, thousands of people
For every 100 women (masculinity ratio), there were 89 men, while in 2014, this indicator showed a ratio of 92 men to 100 women. From the age of 55 onwards, the decline in the number of men compared to women becomes more pronounced, so that for every 100 women over the age of 65 there were 61 men (Table 2.1 in the Annex).
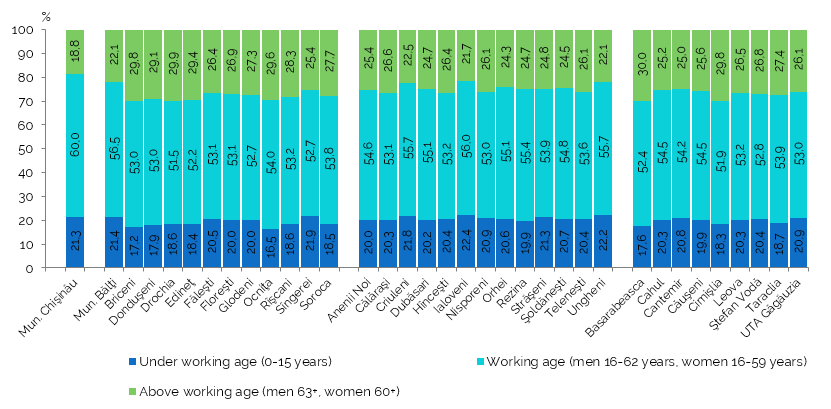
The structure of the population by age groups of economic interest changed in all three categories. Thus, the share of working-age persons3 (men aged 16-62, women aged 16-59) accounted for 55.7% of the total population, down by 9.0 p.p. compared to 2014 (64.7%) (Table 2.1 in the Annex).
The largest share of the population below working age - about 22% - was in the districts of Ialoveni, Ungheni, Sîngerei, and Criuleni, with a proportion of 21.3% in Chișinău. The working-age elderly population was most numerous in Chișinău (60.0% of the municipality's population) and Bălți (56.5%) (Figure 5).
The districts of Basarabeasca, Drochia, Cimișlia, Briceni, and Ocnița had the highest proportions of the population above working age - between 29.6% and 30%, with the national average being 23.7%. while in Chișinău municipality, the share of this population group was the lowest, accounting for 18.8% of the municipality's population (Table 2.4 in the Annex).
Figure 5. Distribution of the population of districts/municipalities by economically relevant age groups,
according to the 2024 census, %
Socio-demographic Index4 In the 2024 census, there were 79 people unable to work (children aged 0-15 and elderly people, including those aged 60 and over for women and 63 and over for men) per 100 people of working age (people aged 16-59/62), while in rural areas this indicator was 85 persons.
Population distribution by citizenship5
According to the final data of the 2024 census, out of the total population with usual residence, approximately 2,383,100 persons or 98.9% declared that they had Moldovan citizenship, down by 0.6 p.p. compared to the 2014 census, of which 389.3 thousand persons or 16.3% declared that they also held the citizenship of another state (up by 10.7 p.p. compared to 2014) (Table 2.5 in the Annex).
The share of persons with dual citizenship was 21% in urban areas, which was 8.6 percentage points higher than in rural areas (12.4%), and the share of men with dual citizenship (17.3%) was higher than the share of women in this category (15.5%).
Of the total population, persons holding citizenship of another state numbered 25,800 (compared to 12,300 in the 2014 census) or 1.1%, living predominantly in urban areas (78.1%) (Table 2.5 in the Annex).
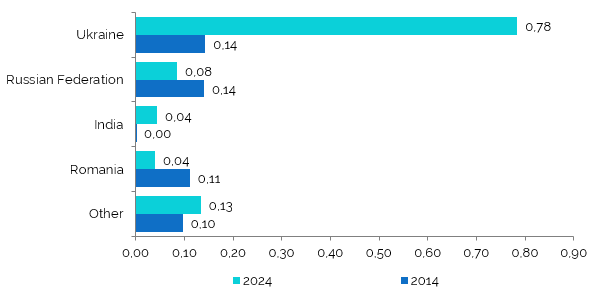
73.1% of persons who held citizenship of another state, or 18.9 thousand persons, were citizens of Ukraine, which constituted 0.78% of the population, an increase compared to the 2014 census (0.14% of the population) (Figure 6 and Table 2.6 in the Annex).
Figure 6. Distribution of the population with citizenship of another country,
according to the 2024 and 2014 censuses, % of total population
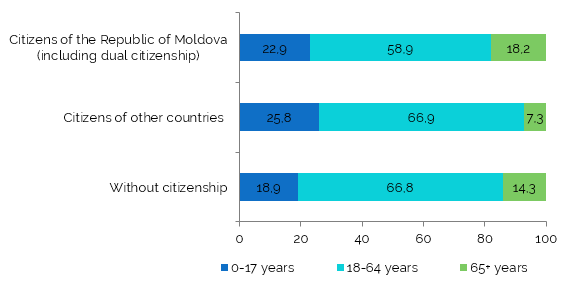
Within the population with usual residence at the time of the 2024 census, persons without citizenship numbered approximately 0.3 thousand, of whom 202 persons (or 66.8%) were aged 18-64 and 57 children (aged 0-17) (or 18.9%) (Figure 7).
Figure 7. Distribution of the population by citizenship and age group,
according to the 2024 census, % of total population
Population structure by place of birth6
Depending on the country of birth, the absolute majority of the country's population of 2,301,000 people (or 95.5%) was born in the Republic of Moldova, and only 106,700 people (or 4.4%) were born in other countries. The largest proportions of persons born in other countries had their usual place of residence in Chișinău municipality, Basarabeasca district, and Bălți municipality, accounting for 7.9%, 7.6%, and 6.9% of the population of these municipalities/districts, respectively (Table 2.7 in the Annex).
By place of birth, 65.1% of the total population who declared their place of birth had their usual residence (lived) in the same locality where they were born, with a higher proportion in rural areas (74.2%) than in urban areas (54.5%), as the rural population is more stable (Table 2.8 in the Annex). In terms of territorial profile, the highest proportions of people living in the same locality where they were born were recorded in the Gagauzia ATU and the Dubăsari and Hâncești districts - with 83.8%, 78.7%, and 77.8% of the population who declared their place of birth in these administrative-territorial units, respectively.
The districts of Ungheni, Fălești, and Soroca recorded the highest proportions of persons born in a locality other than their district of usual residence — 18.5%, 17.1%, and 17.0%, respectively, compared to the national average of 9.5%.
The highest shares of the population born in a district/municipality other than their usual place of residence — 37.0% and 36.7%, respectively—were in the municipalities of Chișinău and Bălți, compared to the national average of 21.0%. 30.6% in urban areas and 12.6% in rural areas.
Legal marital status of the population7
The structure of the population by marital status reveals that, in the 2024 census, married persons accounted for 55.8% of the total population aged 15 and over (compared to 57.4% in 2014), never married persons accounted for 23.6% (compared to 24.6% in 2014), widowed persons accounted for 10.2% (12.2% in 2014), and divorced persons accounted for 10.4% (almost double the share in 2014 - 5.8%) (Figure 8 and Table 2.9 in the Annex).
The share of divorced and never married persons in urban areas was 4.3 p.p. and 2.6 p.p. higher than in rural areas, respectively. In rural areas, married and widowed persons accounted for a higher proportion than in urban areas, by 3.0 p.p. and 3.9 p.p., respectively.
Figure 8. Structure of the population aged 15 and over, by legal marital status, at the 2024 census, %
Chisinau municipality had the highest proportion of people who had never been married – 27.4%, compared to the national average of 23.6% – and the lowest proportion of widowed people – 6.7%, compared to the national average of 10.2%. The top three districts/municipalities by percentage of married persons are as follows: Ialoveni with 60.4%, Ștefan-Vodă with 59.3%, and Sîngerei with 59.2%, while the national average was 55.8%. The top 3 districts/municipalities by percentage of divorced persons include Bălți municipality with the highest percentage of divorced persons at 13.6%, Chișinău municipality at 12.7% and Dondușeni district at 12.3% (Table 2.10 in the Annex).
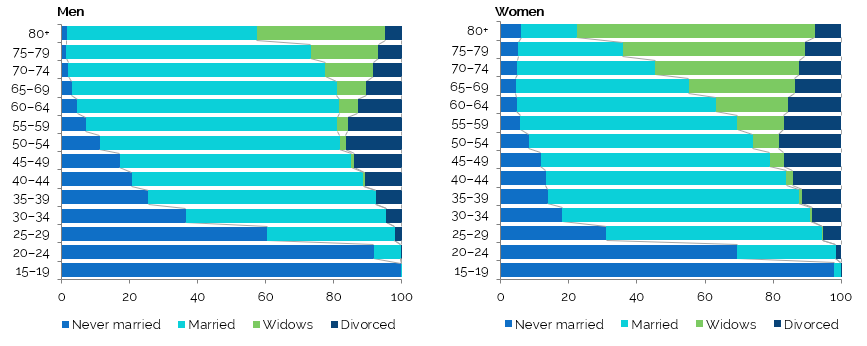
Widowed women were about four times more numerous than widowed men, and men who had never been married were 1.5 times more numerous than women in the same category (Figure 9). By age group, the highest proportion of widowed persons was in the 70-74 age group, with 22% for women and 21.7% for men. Of all divorced women, 13% were aged 60-64, and most divorced men (15%) were aged 50-54. One in two women aged 75-79 was widowed, as was one in five men in the same age group (Table 2.9 in the Annex).
Figure 9. Population structure by legal marital status, age group, and gender, in the 2024 census, %
Female fertility
In the 2024 census, women aged 15–49 (of childbearing age, also referred to as the female childbearing cohort) accounted for 49.4% (or 517,000 women) of the total number of women aged 15 and over, down 7.6 p. p compared to 57% in 2014 (Table 2.11 in the Annex).
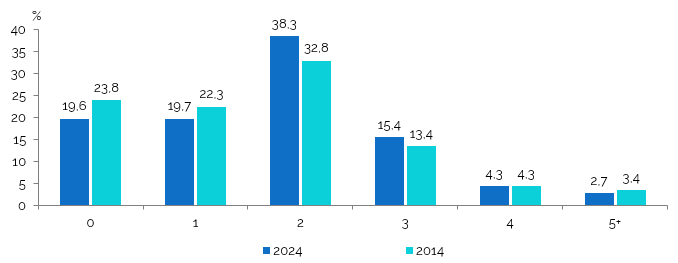
Of the total number of women aged 15 and over who indicated the number of live births8 (1045,6 mii women), 19.7% of women gave birth to 1 child, 38.3% of women gave birth to 2 children, 15.4% of women gave birth to 3 children, 4.3% of women gave birth to 4 children, and 2.7% of women gave birth to 5 or more children (Figure 10). Compared to the 2014 census, the share of women who gave birth to 2 or 3 children increased by 5.4 and 2 percentage points, respectively, while the share of women who did not give birth decreased by 4.2 percentage points, from 23.8% in the 2014 census to 19.6% in the 2024 census. (Figure 10).
Figure 10. Structure of women aged 15 and over by number of live births, in the 2024 and 2014 censuses, %
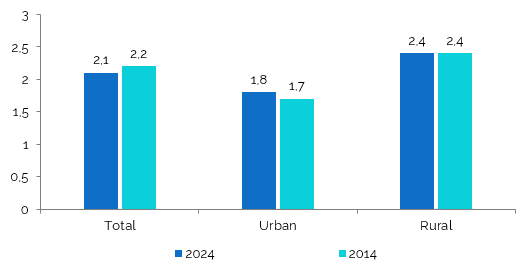
For women aged 50 and over, the average number of live births per woman who had completed their childbearing years (also known as final fertility) was 2.1 children per woman, compared to 2.2 children per woman in the 2014 census (Table 2.11 in the Annex).
The 2024 census data confirm the same trend of higher fertility rates in rural areas compared to urban areas. The average number of live births per 100 women in rural areas was 1.4 times higher than in urban areas, with 204 and 143 live births, respectively, and the final offspring was 1.8 children per woman in cities and 2.4 children per woman in villages (Figure 11). Overall, the average number of live births per 100 women was 175 children.
Figure 11. Final descendants, in the 2024 and 2014 censuses, by place of residence,
in the 2024 census, children per woman aged 50 and over
Annexes:
Notes:
1 The information is presented at the reference time of the 2024 Population and Housing Census, which was 00:00 on April 8, 2024, for the territory where the census work was actually carried out within the 2024 PHC, i.e. excluding the administrative-territorial units on the left bank of the Nistru River, the municipality of Bender (including the village of Proteagailovca), the commune of Chițcani (including the villages of Merenesti and Zahorna), the villages of Cremenciug and Gîsca in the district of Causeni, the commune of Corjova (including the village of Mahala) in the district of Dubasari, as well as the village of Roghi in the commune of Molovata Noua, district of Dubasari..
2 Population with usual residence (the "resident" population or PRO) – represents the population that has lived predominantly in the country in the last 12 months prior to 08.04.2024 (the census reference date), regardless of temporary absences for the purpose of rest, vacation, visits to relatives and friends, business, medical treatment, or religious pilgrimages (Article 4 of Law 231/2022 on the population and housing census (ro)).
3 For both the 2024 and 2014 censuses, the working-age population will be defined as men aged 16-62 and women aged 16-59.
4 Socio-demographic Index - the ratio of children (aged 0-15) and elderly people (aged 60/63) to 100 people of working age (aged 16-59/62).
5 Citizenship: represents the legal affiliation of a natural person (citizen) to a state, acquired by birth, naturalization, marriage, etc.
6 Place of birth: is considered to be the locality and country where the mother lived at the time of birth, not the locality where the medical institution where the mother gave birth is located. Information on the place of birth was collected in accordance with the administrative-territorial organization of the Republic of Moldova in force at the time of the census. Information about the country of birth was collected based on current international borders.
7 Legal marital status refers to the population aged 15 years and over and represents the legal status of a person in terms of family relationships, classifying the population into the following categories:
- Never married: people who stated that they had never been officially married;
- Married: persons legally married (marriage registered with civil registry offices). Religious weddings/engagements in churches, mosques, synagogues, etc. are not considered marriages;
- Divorced: - persons who are officially divorced, with the divorce registered at the civil registry office, and who have not remarried;
- Widowed: check this box if the person's spouse has died and they have not remarried.
8 Number of live births - the number of live births during a woman's lifetime, regardless of whether they are alive or dead at the time of the census, whether they live in their mother's household or not, and whether they are from her current marriage, a previous marriage, or outside of marriage.
Methodological clarifications:
Population and Housing Census (PHC) is a comprehensive statistical survey, whose primary objective is to produce official statistics on population and housing that are internationally comparable.
2024 PHC was implemented in accordance with national legislation, taking into account international recommendations, thus ensuring global and regional comparability (including the recommendations for population and housing censuses of the United Nations (UN), the Conference of European Statisticians for the 2020 round of population and housing censuses, Regulation (EC) No. 763/2008 of the European Parliament and of the Council, etc.).
The reference moment for the 2024 Population and Housing Census was 00:00 on April 8, 2024.
Within the framework of 2024 PHC, in order to ensure the completeness/comprehensiveness and accuracy of the data, a number of new methods and techniques were applied, compared to previous censuses, such as:
- Interviewing people at their usual place of residence using a tablet (CAPI) and recording their answers with an electronic application. The use of digital technologies has significantly improved the quality of the data collected, helped to ensure confidentiality, and speeded up the interview process.
- The collection of the individual's state identification number (ID) within the 2024 PHC allowed for the combination and integration, for the purpose of producing official census statistics, of personal data collected directly from respondents and data collected indirectly from administrative and private data sources.
- The period for conducting the enumeration was extended to three months, compared to the previous PHC, which was limited to 14 days.
- At least 5 home visits were made by enumerators in cases where there was no contact with the household.
- Diversifying census methods and techniques and facilitating the census has contributed to increasing population coverage in the 2024 PHC, including:
- Marking the date of repeated visits by the enumerator
- Facilitating the census by completing the online form on the NBS website
- Functioning of the PHC green line for interaction with the population
- Data collection in electronic format, through interviews facilitated by electronic devices (CATI) or via the Internet (CAWI - for the census of diplomatic mission and consulate staff)
- Functioning of fixed population census points during the last week of the census, offering the possibility for persons who were not included in the census to be counted at the premises of the territorial offices of the NBS, etc.
- Conducting a representative Post-Enumeration Survey (PES) for the Republic of Moldova at the level of development regions, urban/rural areas, gender, and major age groups (in 2014, the PES was conducted only for the city of Chișinău) – to assess undercoverage in the PHC.
- PHC over-coverage assessment study.
Use of administrative data sources (ADS) and the "signs of life" method to supplement field-collected data and estimate the total population of the country (including those not covered by the PHC).
Relevant information: