

(Infographics) Discover the NBS’s main products, statistical surveys and new tools
On the occasion of Statistician’s Day, celebrated annually on 20 October, the National Bureau of Statistics (NBS) presents a series of infographics highlighting the institution’s main statistical products, new statistical surveys and new tools through which official data are made available to users.
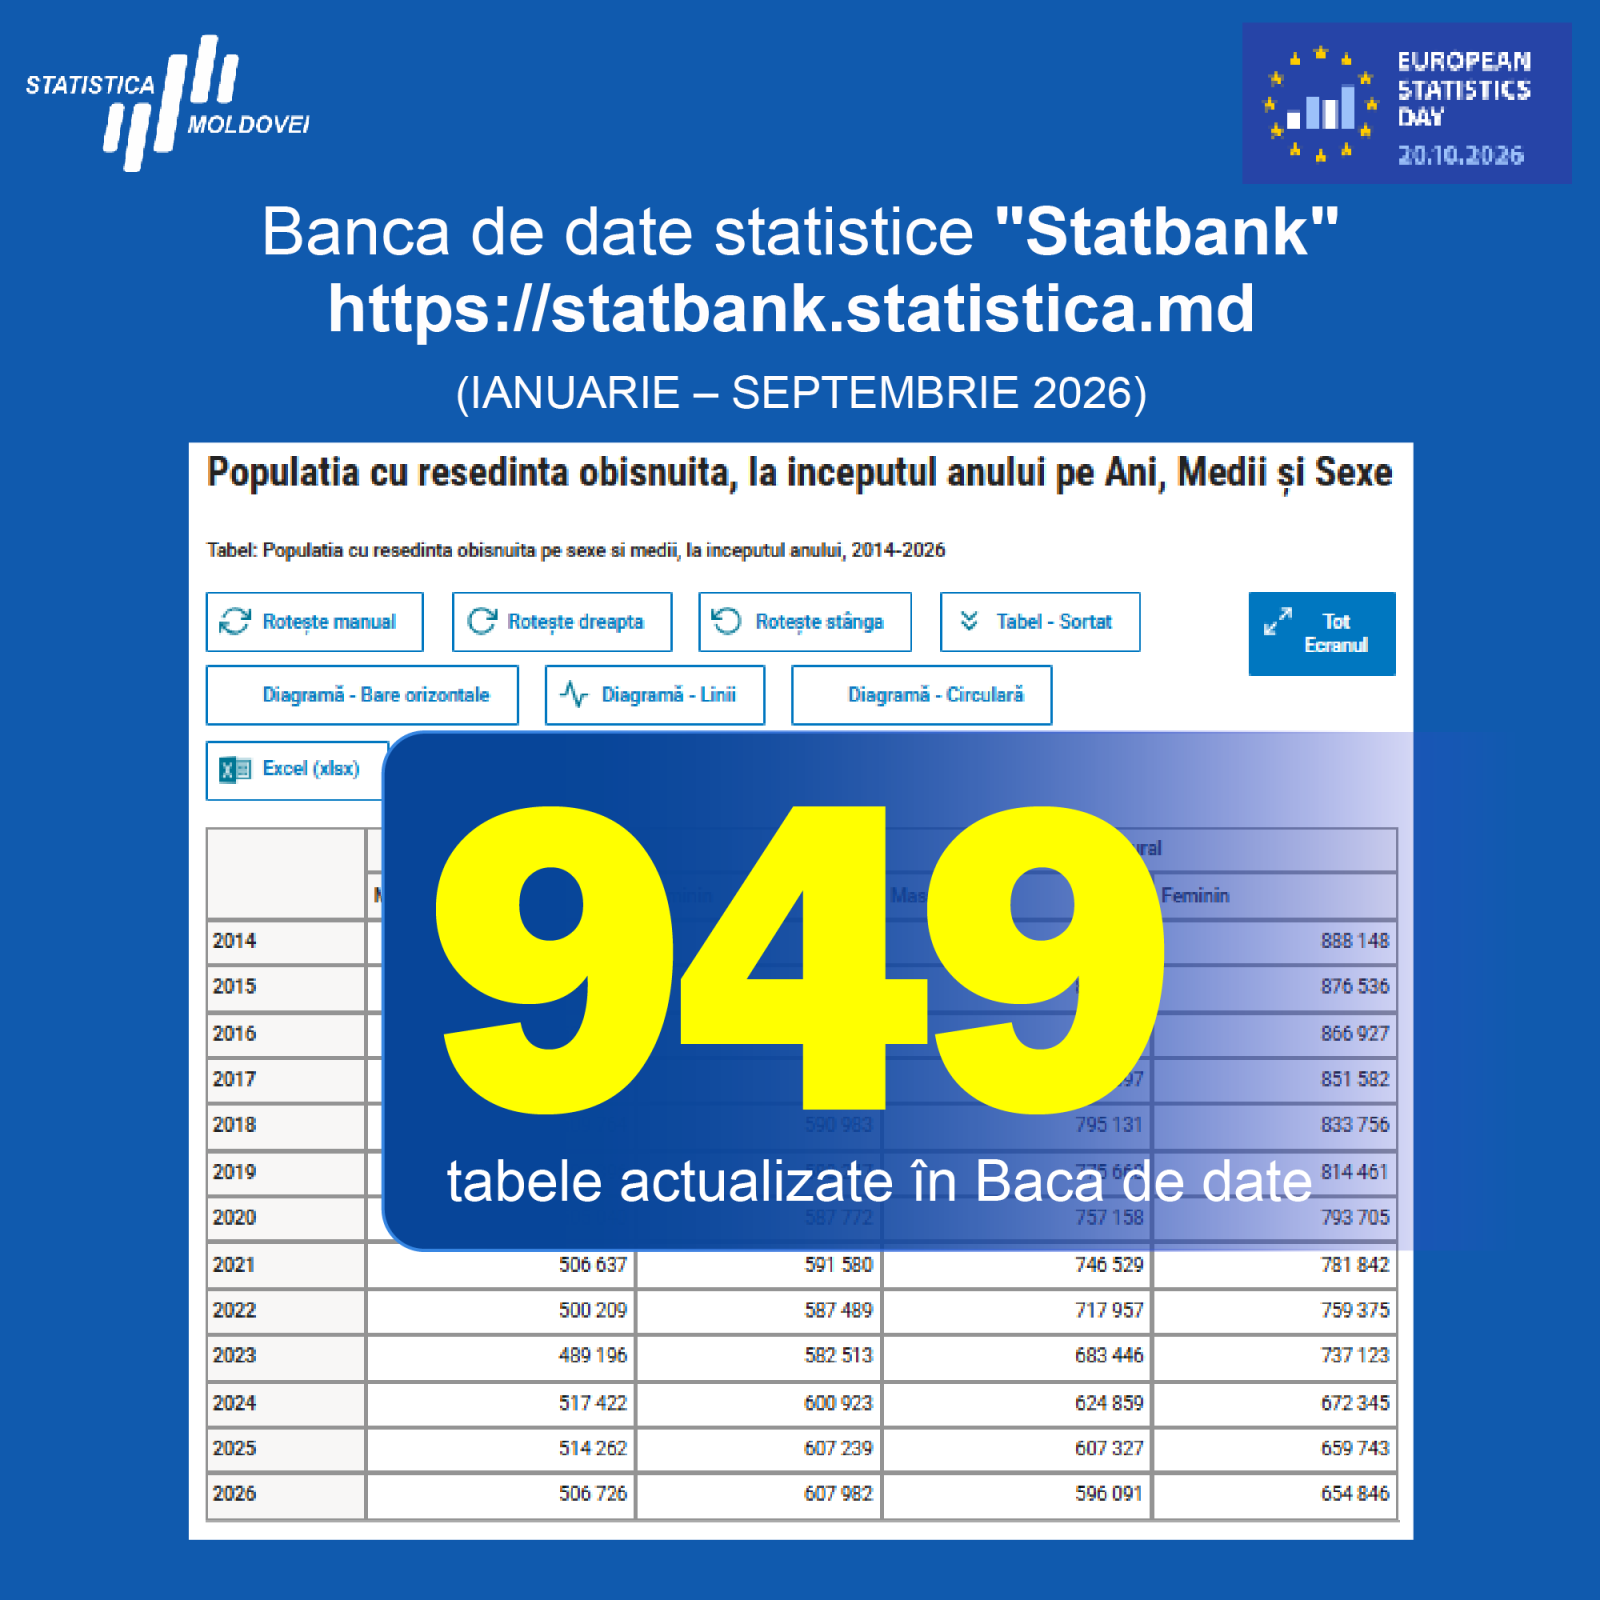
The infographics present the activities and results for January-September 2026, highlighting the role of the NBS’s official website and the “Statbank” Statistical Databank in providing access to statistical information. During the reference period, the official website recorded 1.5 million views and 349,000 users, while the Statistical Databank recorded 934,000 views and 152,000 users.
The series of infographics also includes information on NBS statistical releases, infographics and publications, new data visualisation tools, newly introduced statistical surveys and pilot surveys conducted during this period.
Through this initiative, the NBS aims to increase the visibility of its main statistical products, make official data sources easier to identify and encourage their use by different user groups.
We invite you to discover the infographics and explore the NBS’s main statistical products, new surveys and new tools!
Reference materials:




- Report a mistake. Select the desired text and press CTRL + ENTER