
Preliminary results of the 2024 Population and Housing Census1
The National Bureau of Statistics informs that the number of usually resident population2 on the reference date of the Population and Housing Census (PHC) 2024 - April 8, 2024 (according to preliminary results) was 2,401.2 thousand persons.
Compared to the 2014 census, according to preliminary 2024 census data:
- The number of the population (usually resident) decreased by 13.9%;
- The share of the urban population increased from 38.5% to 46.4% (by 7.9 percentage points);
- Almost every 3rd usually resident person in the country lived in Chisinau municipality, compared to every 5th person in the 2014 Census.
Population size and structure by area of residence and sex
In the 2024 census, 2,424.0 thousand persons were enumerated 3, of which 2,322.0 thousand were usually resident. Based on the Post-Enumeration Survey and the use of relevant administrative data, the net coverage 4 of the usually resident population in the PHC was estimated to be 79.2 thousand persons (Table 1 in the Annex). Thus, the total estimated number of usually resident population (hereinafter population), adjusted based on the net coverage, on 8 April 2024, was 2,401.2 thousand persons.
According to the preliminary results of the 2024 census, out of 2,401.2 thousand persons, 46.4% (or 1,113.7 thousand persons) lived in urban areas and 53.6% in rural areas (1,287.5 thousand persons) (Table 2 in the Annex). The population decreased by 13.9%, compared to the 2014 census (average annual rate of 1.3%). The decrease in the population during this period was influenced by the reduction in the natural population growth (especially during the pandemic period) and the negative balance of external migration.
The country's urbanization process continues to be attested, with the share of the urban population increasing by 7.9 percentage points in the last 10 years compared to the 2014 census (Figure 1).
Figure 1. Population structure by area of residence: 2024 and 2014 censuses, %

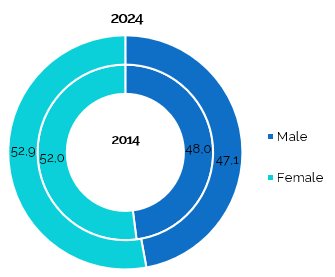
The structure by sex of the population registered in the 2024 census underwent insignificant changes compared to that of 2014. The female population continued to be predominant in 2024, constituting 1,269.8 thousand persons or 52.9% of the total population (compared to 52.0% in 2014), and the male population constituted 1,131.4 persons or 47.1% of the country's population (compared to 48.0% in the 2014 PHC) (Table 2 in the Annex).
Figure 2. Population structure by sex: 2024 and 2014 censuses, %
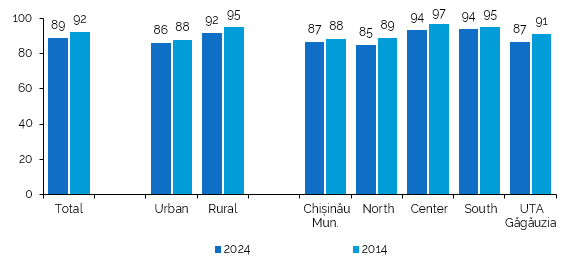
For every 100 females (male ratio 5) there were 89 males, while in 2014 this indicator indicated a ratio of 92 males per 100 females. The most pronounced difference is observed in the development regions (DR) North (85 males per 100 females), ATU Gagauzia and Chisinau (87 males per 100 females), and the smallest difference - in the Central and Southern regions, where there are 94 males per 100 females (Figure 3).
Figure 3. Masculinity ratio: 2024 and 2014 censuses, males per 100 females
Population by development regions
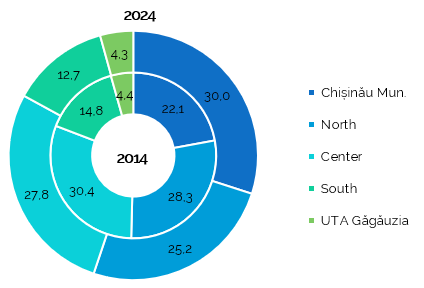
The analysis of the population by development regions, as of the 2024 census, shows an increase in the population in Chisinau municipality up to 719.7 thousand persons, 16.7% more than in the 2014 PHC. The share of the population of Chisinau municipality in the total number in the country increased by 7.9 percentage points, so that almost every 3rd usually resident person of the country lived in Chisinau municipality, while, in the 2014 census, almost every 5th person lived in Chisinau municipality. In the other development regions, a decrease in the population was recorded in 2024 compared to 2014.
The largest decrease was recorded in the DR South, whose population at the 2024 PHC was 306.1 thousand persons (26.0% less than in 2014). The population of the DR North decreased by 23.4%, that of the DR Center by 21.3%, and that of the UTA Gagauzia by 15.3% (Table 2 in the Annex and Figure 4).
Figure 4. Population structure by development regions: 2024 and 2014 censuses, %
Population structure by age groups
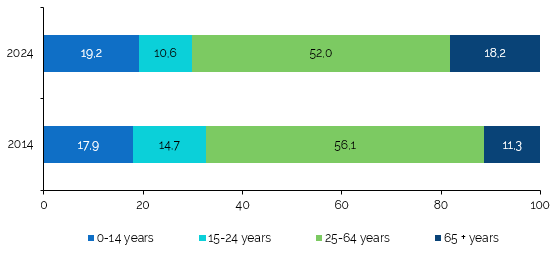
Analyzing the population distribution by age groups it is noted that the group of 65 years and over constituted 437.2 thousand persons, recording an increase in the population structure from 11.3% according to PHC 2014 to 18.2% according to PHC 2024, thus the population aging process is progressing. (Figure 5). At the same time, the share of the population aged 0-14 increased by 1.2 percentage points and the share of the population aged 15-24 and 25-64 decreased by 4.1 percentage points each compared to PHC 2014. Of the persons aged 65 and over, 61.9% are female and 58.2% are from rural areas (Table 3 and 4 in the Annex).
Figure 5. Population structure by age groups: 2024 and 2014 censuses, %
Population structure by citizenship
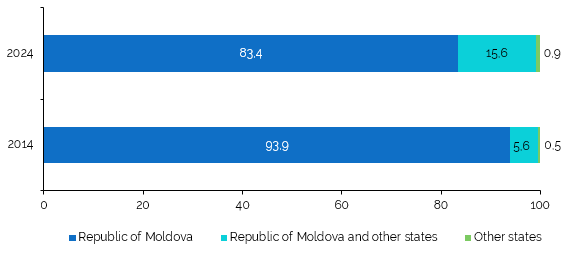
In the 2024 census, of the total population, 99.1% declared that they had the citizenship of the Republic of Moldova, of which 15.6% of persons declared that they also held the citizenship of another state(s), compared to the 2014 census in which 99.5% of the population declared holding the citizenship of the Republic of Moldova, including 5.6% of the citizenship of our country and other states (Figure 6). In the municipality of Chisinau, there is a higher share of persons who simultaneously hold the citizenship of the Republic of Moldova and other states - 26.2%, registering an increase, compared to the 2014 census, by 11.7 percentage points (Table 5 in the Annex).
Figure 6. Population structure by citizenship: 2024 and 2014 censuses, %
Population structure by ethnicity
Of the total population that declared their ethnicity, in the 2024 census, persons who declared themselves Moldovan and Romanian constituted 77.2% and 7.9%, respectively. Among ethnic minorities, 4.9% declared themselves Ukrainian, 4.2% Gagauz, 3.2% Russian, 1.6% Bulgarian and 0.4% Roma/Gypsy (Figure 7).
Compared to the 2014 census6, the 2024 census shows an increase in the share of the population that declared itself as Moldovan (from 75.3% to 77.2%), Romanian (from 6.7% to 7.9%) and Roma/Gypsies (from 0.3% to 0.4%). The other ethnic groups register a decrease in their proportion in the total population: Ukrainians from 6.8% to 4.9%, Russians from 4.1% to 3.2%, Gagauzians from 4.4% to 4.2% and Bulgarians from 1.9% to 1.6%. Other ethnic groups account for 0.5% of the total population that declared their ethnicity (Table 6 in the Annex).
Figure 7. Population structure by ethnicity: 2024 and 2014 censuses, %

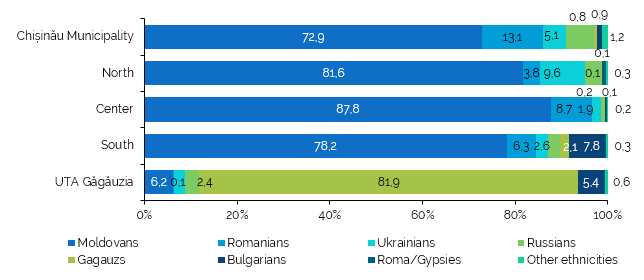
In territorial terms, the distribution of ethnic groups has not undergone significant changes, at the regional level the population that declared itself Moldovan predominates (from 87.8% in the DR Center to 72.9% in the municipality of Chisinau), with the exception of the UTA Gagauzia where the majority (81.9%) declared themselves Gagauz. Ukrainians and Russians constitute increased shares in the Northern DR (9.6% and, respectively, 3.5%) and the municipality of Chisinau (5.1% and, respectively, 5.9%), and Bulgarians - in the Southern DR (7.8%) (Figure 8).
Figure 8. Population structure by ethnicity and development regions: PHC 2024, %
Population structure by mother tongue
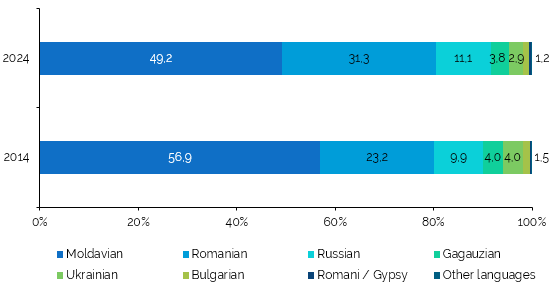
Of the total population that declared their mother tongue at the 2024 PHC, 49.2% declared "Moldovan" as their mother tongue and 31.3% - Romanian (Figure 9).
Thus, the share of the population that declared Romanian as their mother tongue is increasing by 8.1 percentage points, compared to the 2014 census (23.2%), and of those who declared "Moldovan" - decreasing by 7.8 percentage points (56.9% in the 2014 PHC). Among other languages declared as their mother tongue, Russian stands out - with 11.1%, followed by Gagauz with 3.8%, Ukrainian with 2.9% and Bulgarian - 1.2%.
Figure 9. Population structure by mother tongue: 2024 and 2014 censuses, %
The territorial distribution shows a higher share of those who declared Romanian as their mother tongue in the municipality of Chisinau (47.9%), Gagauz in the UTA Gagauzia (77.7%), Ukrainian in the North DR (6.3%) and Bulgarian in the South DR (6.7%). The Russian language has a more significant share in the North DR (13.0%) and the urban area in all regions (Table 7 in the Annex).
Population structure by language usually spoken
Although structurally close to the mother tongue, the language usually spoken presents some differences.
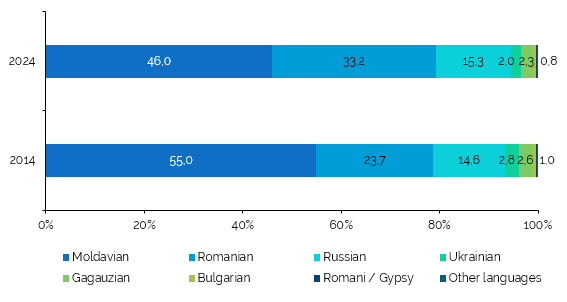
According to the declarations of usually resident population enumerated, speakers of (usually) the "Moldovan language" constitute 46.0% of the population, and of the Romanian language - 33.2%, totaling an increase of 0.5 percentage points, compared to the 2014 census. The share of the Russian language, as a usually spoken language, is higher than that of the other languages, representing 15.3%, while their share is lower: Gagauz 2.3%, Ukrainian 2%, Bulgarian 0.8%, Romani/Gypsy 0.3% (Figure 10).
Compared to the previous census, there is a significant increase in the share of Romanian as a usually spoken language, by 9.5 percentage points, a moderate increase in the share of Russian - by 0.7 percentage points. At the same time, there is a decrease in the share of Ukrainian, Gagauz and Bulgarian languages by 0.8 percentage points, 0.3 percentage points and 0.2 percentage points, respectively. (Table 8 in the Annex).
Figure 10. Population structure by language usually spoken: 2024 and 2014 censuses, %
Population structure by religion
Religion, like other ethno-cultural characteristics (ethnicity and language), was recorded on the free declaration of the respondents.
The majority of persons declared themselves to be Orthodox (95.0%). Among the more representative confessional minorities, the following declared themselves: Baptists (1.1%), Jehovah 's Witnesses (0.7%), Pentecostals (0.5%), Adventists (0.3%). The following declared themselves: atheists 0.6% and without religion 0.8% (Figure 11 and Table 9 in the Annex).
Figure 11. Population structure by religion: 2024 and 2014 censuses, %

Country of birth
The country's population is overwhelmingly born in the Republic of Moldova (95.9%), with a higher share in rural areas (98.1%). (Figure 12).
In terms of age groups, a higher share of persons born in another country was recorded for the age group 65 years and over, of 9.3% for the whole country and 18% in urban areas, compared to the average value for the country of 4.1% (Table 10 in the Annex).
Figure 12. Population structure by country of birth, by age group: 2024 and 2014 censuses, %

Population by difficulties in carrying out daily activities
Information on difficulties in carrying out daily activities was collected for persons aged 2 years and over, also based on the free declaration of the enumerated persons.
Seeing difficulties
Of the total population aged 2 years and over, 28.9% reported experiencing seeing difficulties, even if they wear glasses or contact lenses. Of these, 6% experienced severe seeing difficulties or total incapacity (Figure 13).
In the population aged 65 and over, 16.6% reported severe seeing difficulties, and 0.9% declared incapacity to see (or a total of 17.5% severe difficulties or total incapacity) (Table 11 in the Annex).
Figure 13. Population structure by seeing difficulties in carrying out daily activities,
by age groups: the 2024 census, %
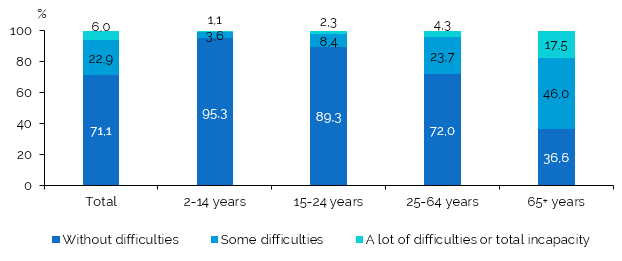
The percentage of women experiencing severe seeing difficulties or total incapacity to see is 2.3 percentage points higher than the percentage of males (Table 12 in the Annex).
Hearing difficulties
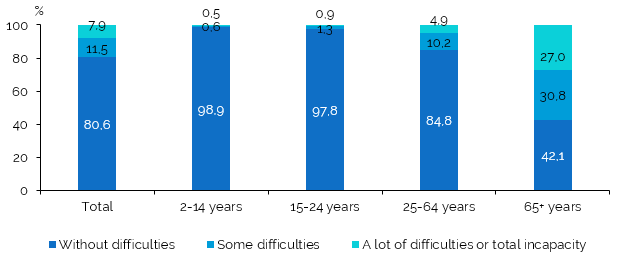
Of the total population aged 2 years and over, 10.9% reported hearing difficulties, even when using hearing aids. Of these, 2.2% reported severe hearing difficulties or total incapacity to hear.
In the population aged 65 and over, 8.2% reported severe hearing difficulties and 0.4% total incapacity to hear (or a total of 8.6% severe difficulties or total incapacity) (Figure 14).
Figure 14. Population structure by hearing difficulties in carrying out daily activities,
by age group: PHC 2024 %

Severe hearing difficulties or total hearing loss are slightly more prevalent in rural areas than in urban areas, with a difference of 0.7 percentage points (Table 11 in the Annex).
The percentage of women experiencing severe hearing difficulties or total incapacity to hear is 0.3 percentage points higher than the percentage of men (Table 12 in the Annex).
Moving difficulties (walking and climbing stairs)
Of the total population aged 2 years and over, 19.4% of persons reported moving difficulties, including difficulty walking or climbing stairs. Of these, 7.9% reported severe moving difficulties or inability to walk or climb stairs (Table 11 in the Annex).
In the population aged 65 years and over, 23.3% reported great moving difficulties, and 3.7% could not walk or climb stairs at all (or a total of 27.0% severe difficulties or total incapacity) (Figure 15).
Figure 15. Population structure by moving difficulties in carrying out daily activities,
by age groups: PHC 2024, %
Severe moving difficulties or the incapacity to walk or climb stairs are significantly more prevalent in rural areas, with a difference of 4.0 percentage points compared to urban areas.
The percentage of women experiencing severe moving difficulties or total inability to walk or climb stairs is 3.2 percentage points higher than the percentage of men (Table 12 in the Annex).
Memory difficulties
Of the population aged 2 years and over, 10.1% reported memory or concentration difficulties. Of these, 1.6% reported severe memory difficulties and 0.2% reported inability to remember or concentrate. (Table 11 in the Annex).
In the population aged 65 and over, 4.8% reported severe memory/concentration difficulties, and 0.5% had a total inability to remember (or a total of 5.3% severe difficulty or total inability to remember/concentrate) (Figure 16).
Figure 16. Population structure by memory difficulties in carrying out daily activities,
by age groups: PHC 2024, %
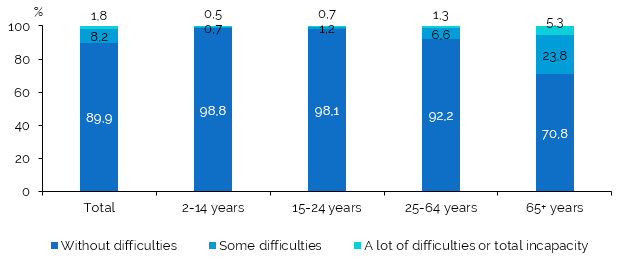
The percentage of women experiencing severe memory difficulties or total inability to memorize is practically similar to that of men - 1.8% and 1.9%, respectively (Table 12 in the Annex).
Annex: Tables on the size and structure of the population by sex, major age groups, areas of residence and country of birth, as well as the distribution of the population by development regions and according to ethno-cultural characteristics and difficulties in carrying out daily activities (12 tables (format.xlsx).
Notes:
1 The data are presented without the territory on the left side of the Nistru River, Bender municipality, Corjova commune and Roghi village in Molovata Nouă commune of Dubăsari district, Chițcani, Cremenciug and Gâsca communes in Căușeni district.
2 Usually resident population (resident) - the population that lived predominantly in the last 12 months before 8.04.2024 (census reference date) in the country, regardless of temporary absences for the purpose of recreation, leave/vacation, visits to relatives and friends, business, medical treatment or religious pilgrimages (art. 4 of Law 231/2022 on the population and housing census).
3 Compared to the provisional data on the number of persons enumerated, disseminated at the end of the census, all duplications allowed within the PHC were eliminated
4 Net coverage is the difference between the number of persons not covered and over-covered in the census. The net coverage was estimated using data from the Post-Enumeration Survey and data on state border crossings from the General Inspectorate of Border Police.
5 The sex ratio indicates the number of men per 100 women.
6 The population structure by citizenship, ethnicity, religion, languages, country of birth in the 2014 PHC was calculated based on the usually resident population.
Methodological details:
The Population and Housing Census (PHC) is an exhaustive statistical survey, the primary objective of which is to produce official population and housing statistics that are internationally comparable.
The 2024 PHC was carried out in accordance with national legislation, taking into account international recommendations, thus ensuring global and regional comparability (including the recommendations of the Conference of European Statisticians for the 2020 round of population and housing censuses, Regulation (EC) No. 763/2008 of the European Parliament and of the Council on population and housing censuses, and the United Nations Principles and Recommendations for Population and Housing Censuses).
The reference moment of the 2024 Population and Housing Census was 00:00 on April 8, 2024.
Relevant information:
Basic concepts:
Usual residence: the place where a person usually spends their daily rest time, regardless of temporary absences for the purpose of rest, leave/vacation, visits to relatives and friends, business, medical treatment or religious pilgrimages.
Population by area of residence: refers to the division of the population according to the area of residence: urban (cities) and rural (villages), according to the territorial-administrative status of the locality. This structure reflects the geographical and socio -economic distribution of the population. All persons who were enumerated according to their usual place of residence within the Fruit Associations (in Romanian - Întovărășirilor Pomicole) were considered to be part of the rural area.
Population by sex: Sex is a biological characteristic of a person. A person can be male or female.
Population by age group: classification of a human community according to the age of each individual. This division is essential to understand the demographic structure of a population and to analyze various social, economic and cultural phenomena.
Ethnicity (nationality) is a personal and collective identity assumed based on characteristics related to origin, language, culture, tradition, history, religion, race and other aspects. Ethnicity is assumed at a subjective level by each person. The registration of ethnicity was based on the free declaration of the enumerated persons.
Mother tongue: is considered the first language learned in childhood and spoken in the family, the language in which a person expresses their thoughts.
Language usually spoken: It is considered the language in which a person communicates the most, in the family, at work, in society. This may or may not coincide with the mother tongue.
Religion: a complex and multidimensional concept that has been defined and interpreted in countless ways throughout history. Essentially, religion can be viewed as a system of beliefs and practices related to what persons consider to be sacred, divine, or transcendent, assumed on a subjective level by each person.
Citizenship: represents the legal membership of a natural person (citizen) in a state, acquired through birth, naturalization, marriage, etc.
Place of birth: the locality and country where the mother lived at the time of birth is considered, not the locality where the medical institution where the mother gave birth is located.
Difficulties in carrying out daily activities: data were obtained from the population aged 2 years and over based on respondents' answers to questions (formulated in accordance with the recommendations of the UN Washington Group on Disability Statistics) regarding the difficulties they experience in carrying out daily activities due to problems with:
- seeing (even if they wear glasses),
- hearing (even with a hearing aid),
- walking or climbing stairs,
- memorization/concentration (keeping in mind).
The responses of the enumerated population included the options:
- without difficulty
- some difficulties (difficulties are felt little)
- great difficulties (difficulties are felt a lot)
- they don't see/hear/walk/remember at all.
- Snigalitea NașcoDeputy Head of Division
Census Division
- Report a mistake. Select the desired text and press CTRL + ENTER