Evolution of consumer prices in the Republic of Moldova in January 2023
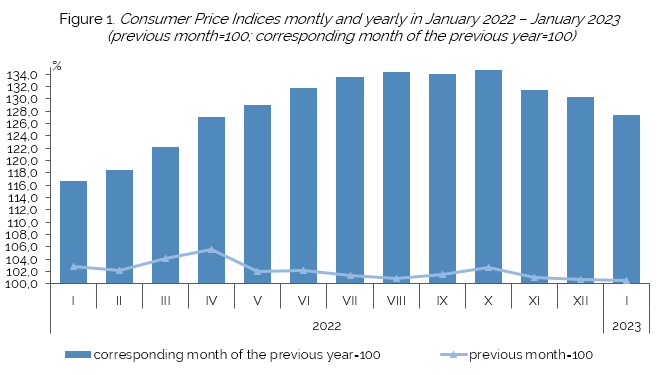
The National Bureau of Statistics informs that average consumer prices in January 2023 compared to December 2022 increased by about 0,5% (compared to 2,8% in the same month of 2022). The increase in average consumer prices was determined by the increase in prices of:
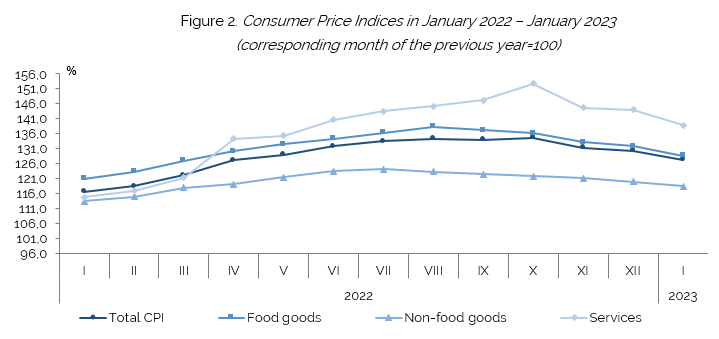
- food by 1,1%, contributing to the increase in average consumer prices by about 0,4%,
- non-food goods by 0,5%, contributing to the increase in average consumer prices by 0,2%.
At the same time, prices of services provided to the population in January 2023 decreased on average by 0,7%, contributing to the attenuation of the increase in average consumer prices by about 0,2%.
Table 1. Inflation rate in December 2022
Consumer goods and services | Weights of expenditure groups (by decimals | January 2023, in % compared to: | Contribution on the overall change in consumer price | |
December 2022 | January 2022 | |||
Total CPI | 10000 | 0,45 | 27,31 | 0,45 |
Food goods | 3669 | 1,12 | 28,59 | 0,41 |
Non-food goods | 3932 | 0,52 | 18,44 | 0,20 |
Services | 2399 | -0,69 | 38,86 | -0,17 |

Table 2. Consumer price indices in December 2022, by divisions of consumer goods and services, according to COICOP
Division | Specification | Weights of expenditure groups (by decimals) | January 2023, in % compared to: | Contribution on the overall change in consumer price in January 2023 compared with the December 2022 | |
December 2022 | January 2022 | ||||
| Total CPI | 10000 | 100,45 | 127,31 | 0,45 |
01 | Food and non-alcoholic beverages | 3504 | 101,13 | 129,09 | 0,40 |
02 | Alcoholic beverages and tobacco | 355 | 103,68 | 118,50 | 0,13 |
03 | Clothing and footwear | 887 | 100,10 | 112,46 | 0,01 |
04 | Housing, water, electricity, gas and other fuels | 1190 | 98,96 | 166,03 | -0,12 |
05 | Furnishings, household equipment and routine household maintenance | 864 | 100,34 | 118,48 | 0,03 |
06 | Health | 728 | 99,08 | 106,89 | -0,07 |
07 | Transport | 996 | 101,07 | 134,49 | 0,11 |
08 | Communication | 452 | 99,96 | 104,97 | 0,00 |
09 | Recreation and culture | 274 | 95,83 | 113,89 | -0,11 |
10 | Education | 116 | 102,17 | 124,86 | 0,03 |
11 | Restaurants and hotels | 278 | 100,69 | 123,83 | 0,02 |
12 | Miscellaneous goods and services | 357 | 101,18 | 118,14 | 0,04 |

Annual inflation
Average consumer prices in January 2023 compared to January 2022 ( in the last 12 months) increased by 27,3%, including food by 28,6%, non-food goods by 18,4% and household services by 38,9%.
More detailed information is available in Romanian language.
- Elizaveta TodicăHead of Division
Consumer Price Statistics Division
- Report a mistake. Select the desired text and press CTRL + ENTER


