

Consumer price indices in the Republic of Moldova in December 2023 and in 2023
National Bureau of Statistics informs that average consumer prices in December 2023:
decreased compared to November 2023 by about 0.4%;
increased compared to December 2022 (in the last 12 months) by about 4.2%.
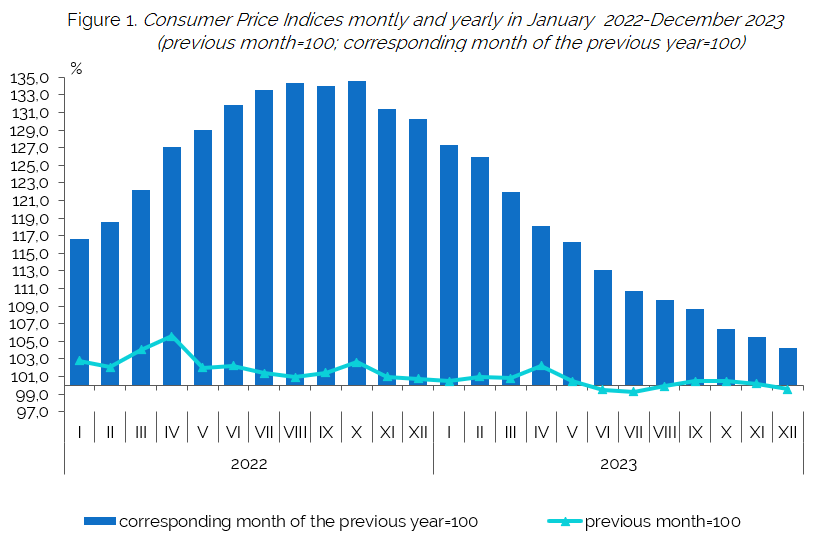
In December 2023, compared to November 2023, average consumer prices decreased by 0,4% (for information: in December 2022 compared to November 2022, average prices increased by 0,8%).
The decrease in average consumer prices was mainly influenced by a 3,8% reduction in tariffs for services provided to households, thus contributing to a decrease in average consumer prices of around 0,9%. In December compared to November 2023, regulated tariffs for electricity supply3 decreased by 3,9%. At the same time, as a result of the Government's granting of compensation for the payment of energy bills to household consumers, as estimated, average prices (taking into account compensation) to the gas network were reduced - by 22,8%, for central heating and hot water preparation - by about 42%.
At the same time, in December 2023, average consumer prices increased from the previous month to:
- food products by about 0,8%, contributing to the increase in average consumer prices by 0,3%;
- non-food goods by about 0,4%, contributing to the increase in average consumer prices by 0,2%;
In December 2023 compared to November 2023, among food products, higher increases in average consumer prices were marked for vegetables - by 4,8%, chicken eggs - by 3,8%, fruit - by 2,0%, milk and dairy products - by 0,5%.
At the same time, during the period under review, price decreases were recorded for vegetable oil - by 1,8%, sugar - by 0,7%.
In non-food goods, average consumer prices of footwear and clothing increased during the reporting period by 0,6% and 0,2%, respectively, medicines - by 0,5%, while average consumer prices of fuels decreased by 1,7% (including diesel - by 5,8% and petrol - by 2,7%).
Inflation since the beginning of the year
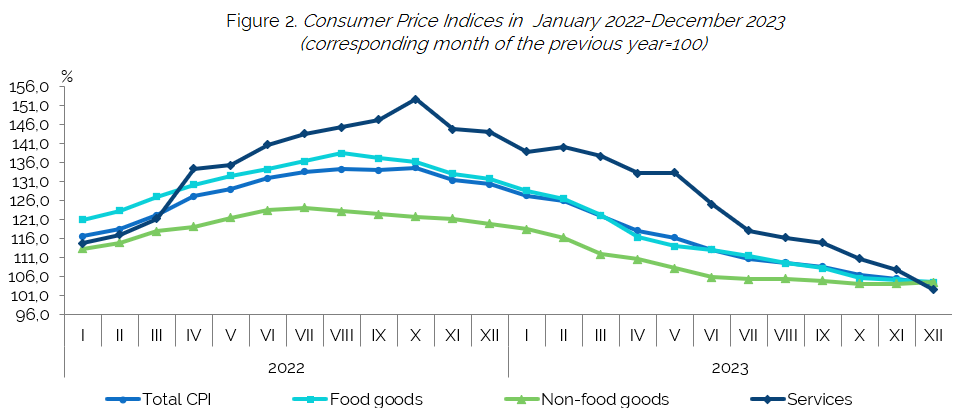
Average consumer prices in December 2023 compared to December 2022 (in the last 12 months) increased by 4,2% (for information: in December 2022 compared to December 2021 average consumer prices increased by 30,2%), including food and non-food products by 4,6% and services provided to the population by 2,5%.
During 2023, higher price increases were recorded for the following food products: fruits and vegetables - by about 12%, meat and canned meat, milk and dairy products - by more than 3%, bread - by 2,2%.
At the same time, during the analysis period, price decreases were recorded for vegetable oil - by 21,1%, sugar - by 4,1%.
The increase in non-food consumer prices was driven by the rise in prices of footwear and clothing - by 9,6% and 5,8% respectively, materials for home maintenance and repair - by 4,3%.
At the same time, consumer prices for fuels decreased - by about 1,4% (including: coal - by 32,3%, liquefied gas - by 13,1%, diesel - by 10,4%, gasoline - by 3,6%).
With reference to the services provided to the population, during 2023, the prices of water supply and sewage services increased - by 24,6%, passenger transport services - by 20,8% (there was a significant increase in prices of air passenger transport services - by 2,3 times), food services - by 6,5%.
At the same time, during 2023 regulated electricity supply tariffs decreased by about 43% and natural gas supply services - by 12,1% (taking into account the compensation granted by the Government to domestic consumers).
It should be noted that the Government's granting of compensation for the payment of energy bills for domestic consumers (natural gas, electricity and heat) contributed by 1,3% on annual growth in average consumer prices.
Average annual inflation
Consumer prices in 2023 compared to 2022 increased on average by 13,4%, including food goods by 13,2%, non-food goods by 8,1% and services provided to the population by 2,8%.
Table 1. Inflation rate in December 20232
Consumer goods and services | Weights of expenditure groups (by decimails) | December 2023, in % compared to: | Contribution on the overall change in consumer price | |
November | December | |||
Total CPI | 10000 | -0,44 | 4,20 | -0,44 |
Food goods | 3669 | 0,84 | 4,62 | 0,31 |
Non-food goods | 3932 | 0,43 | 4,61 | 0,17 |
Services | 2399 | -3,84 | 2,52 | -0,92 |
Source of data in .xlsx format
Table 2. Consumer price index in December2023, by divisions of consumer goods and services, according to COICOP
Division | Specification | Weights of expenditure groups (by decimails) | December 2023, in % compared to: | Contribution on the overall change in consumer price in December 2023 compared with the November 2023 | ||
November | December | |||||
| Total CPI | 10000 | 99,56 | 104,20 | -0,44 | |
01 | Food and non-alcoholic beverages | 3504 | 100,88 | 104,47 | 0,31 | |
02 | Alcoholic beverages and tobacco | 355 | 100,30 | 112,90 | 0,01 | |
03 | Clothing and footwear | 887 | 100,35 | 106,79 | 0,03 | |
04 | Housing, water, electricity, gas and other fuels | 1190 | 91,70 | 96,86 | -0,99 | |
05 | Furnishings, household equipment and routine household maintenance | 864 | 100,49 | 106,05 | 0,04 | |
06 | Health | 728 | 100,39 | 102,75 | 0,03 | |
07 | Transport | 996 | 100,30 | 101,68 | 0,03 | |
08 | Communication | 452 | 100,06 | 100,89 | 0,00 | |
09 | Recreation and culture | 274 | 102,39 | 104,95 | 0,07 | |
10 | Education | 116 | 100,00 | 114,27 | 0,00 | |
11 | Restaurants and hotels | 278 | 100,75 | 106,57 | 0,02 | |
12 | Miscellaneous goods and services | 357 | 100,17 | 110,35 | 0,01 | |
Source of data in .xlsx format
Source of data in .xlsx format
Source of data in .xlsx format
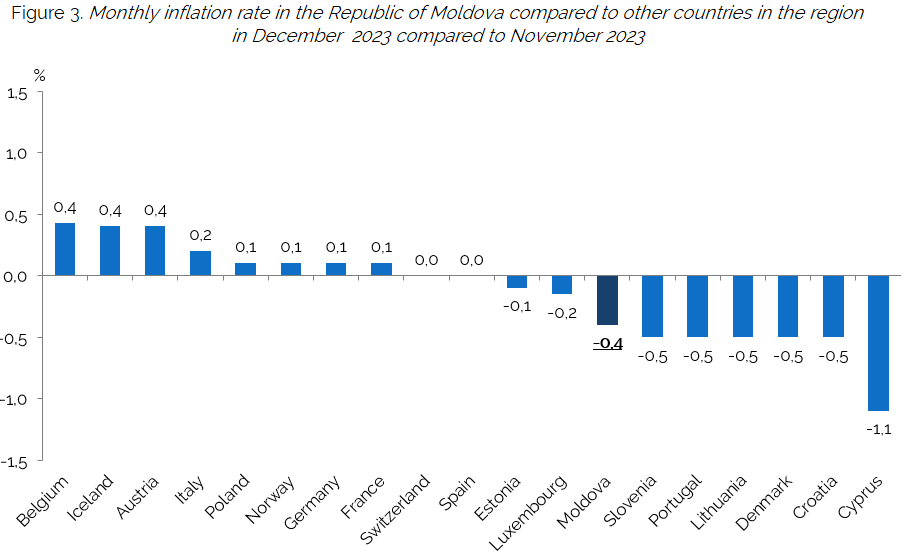
International comparisons of monthly inflation
Preliminary data available on monthly inflation rates for December this year for some countries in the region are presented in Figure 3.
Source of data in .xlsx format
More details can be found in:
Relevant information:
Note:
1 The information is presented without the data on districts from the left side of the Dniester River and the municipality of Bender.
2 Table 1 includes information on the inflation rate on 3 major groups of goods and services, as well as on some representative groups, aggregated according to the national classification used to calculate the CPI:- the major group "Food products" includes milling and bakery products, meat and tinned meat products, fish and tinned fish, milk and dairy products, eggs, fats, fresh fruits, other fruits and preserves, vegetables, potatoes, sweets and spices, non-alcoholic beverages, alcoholic beverages;
- the major group "Non-food goods" includes cigarettes, fabrics, clothing, knitwear, footwear, furniture, means of transport and auto parts, printed publications, fuels and lubricants, other goods;
- the major group "Services" includes education and training, household maintenance services, public catering, health protection, car repair services, transport services, other services.3 Starting from January 2023, the CPI calculations are made using the weighting coefficients calculated on the basis of the data for the year 2021.
More detailed information is available in Romanian language and in Statbank.
- Elizaveta TodicăHead of Division
Consumer Price Statistics Division
- Report a mistake. Select the desired text and press CTRL + ENTER