

Consumer price indices in the Republic of Moldova in February 2024
National Bureau of Statistics informs that average consumer prices in February 2024 increased compared to:
- January 2024 by around 0,7%;
- December 2023 by about 1,5%;
- February 2023 (in the last 12 months) by 4,3%.
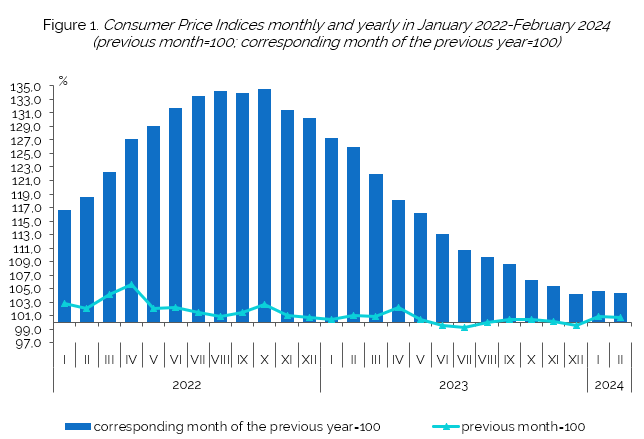
Monthly inflation
In February 2024, compared to January 2024, average consumer prices increased by 0,7% (for information: in February 2023 compared to January 2023, average prices increased by 0,9%).
The increase in average consumer prices was determined by higher prices for:
- food - by about 0,4%, contributing to the increase in average consumer prices by about 0,1%;
- non-food goods - by about 1,1%, contributing to the increase in average consumer prices by about 0,4%;
- services - by 0,6%, contributing to the increase in average consumer prices by about 0,1%.
In February 2024 compared to January 2024, among food products, higher increases in average consumer prices were marked for vegetables - by 3,4% and fruit - by 1,9%. At the same time, during the period under review, price decreases were recorded for chicken eggs - 8,3%, meat, meat preparations and canned meat - by 0,5%, vegetable oil - by 0,3%. In non-food goods, average consumer prices of fuels and combustibles increased in the reporting period - by 3,6% (including: diesel - by 7,5% and gasoline - by 4,5%), drugs (pharmaceutical products) - by 0,5%. At the same time, in February 2024, the price (tariff) for heat energy increased by 13,5% compared to January 2024. At the same time, decreases in prices (tariffs) in the current month were recorded for natural gas tariffs - by 4,4%.
Inflation since the beginning of the year
Average consumer prices in February 2024 compared to December 2023 (from the beginning of the current year) increased by 1,5%, including food - by 1,1%, non-food goods - by 1,8% and services - by 1,6%.
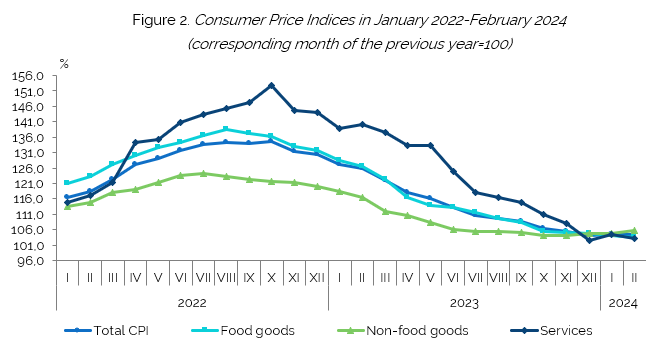
Annual inflation
Average consumer prices in February 2024 compared to February 2023 (in the last 12 months) increased by 4,3% (for information: in February 2023 compared to February 2022 average consumer prices increased by 25,9%), including food by 3,5%, non-food goods by 5,6% and services by 3,1%.
Table 1. Inflation rate in February 20242
Consumer goods and services | Weights of expenditure groups (by decimails)3 | February 2024, in % compared to: | Contribution on the overall change in consumer price in February 2024 compared with the January 2023 | ||
January 2024 | December | February 2023 | |||
Total CPI | 10000 | 0,71 | 1,51 | 4,31 | 0,71 |
Food goods | 3683 | 0,36 | 1,12 | 3,47 | 0,13 |
Non-food goods | 3887 | 1,14 | 1,81 | 5,61 | 0,44 |
Services | 2430 | 0,56 | 1,61 | 3,14 | 0,13 |
Source of data in .xlsx format
Table 2. Consumer price indices in February 2024, by divisions of consumer goods and services, according to COICOP
Division | Specification | Weights of expenditure groups (by decimails) | February 2024, in % compared to: | Contribution on the overall change in consumer price in February 2024 compared with the January 2023 | ||
January 2024 | December | February 2023 | ||||
| Total CPI | 10000 | 100,71 | 101,51 | 104,31 | 0,71 |
01 | Food and non-alcoholic beverages | 3532 | 100,36 | 101,15 | 103,34 | 0,13 |
02 | Alcoholic beverages and tobacco | 309 | 100,72 | 103,24 | 110,56 | 0,02 |
03 | Clothing and footwear | 820 | 100,02 | 100,28 | 106,89 | 0,00 |
04 | Housing, water, electricity, gas and other fuels | 1317 | 100,46 | 101,11 | 96,25 | 0,06 |
05 | Furnishings, household equipment and routine household maintenance | 846 | 100,51 | 100,82 | 105,70 | 0,04 |
06 | Health | 571 | 100,30 | 101,17 | 104,47 | 0,02 |
07 | Transport | 1129 | 103,49 | 104,67 | 105,76 | 0,39 |
08 | Communication | 433 | 99,92 | 100,96 | 101,94 | 0,00 |
09 | Recreation and culture | 288 | 100,45 | 101,37 | 111,05 | 0,01 |
10 | Education | 90 | 101,30 | 101,66 | 109,43 | 0,01 |
11 | Restaurants and hotels | 302 | 100,12 | 101,20 | 106,47 | 0,00 |
12 | Miscellaneous goods and services | 362 | 100,59 | 101,07 | 109,09 | 0,02 |
Source of data in .xlsx format
Source of data in .xlsx format
Source of data in .xlsx format
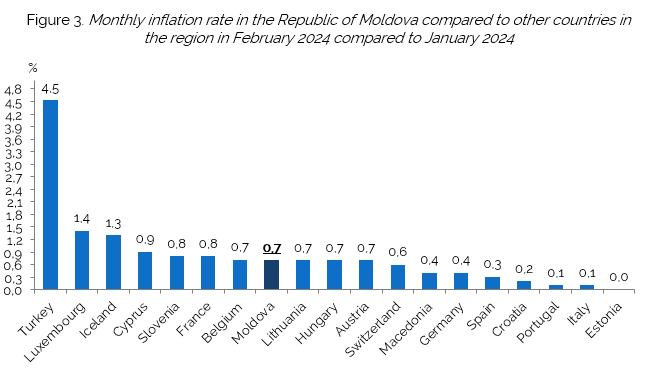
International comparisons of monthly inflation
Preliminary data available on monthly inflation rates for February this year for some countries in the region are presented in Figure 3.
Source of data in .xlsx format
More details can be obtained in:
Relevant information:
Notes:
1 The information is presented without the data on districts from the left side of the Dniester River and the municipality of Bender.
2 Table 1 includes information on the inflation rate on 3 major groups of goods and services, as well as on some representative groups, aggregated according to the national classification used to calculate the CPI:
- the major group "Food products" includes milling and bakery products, meat, meat preparations and preserves, fish and preserved fish, milk and dairy products, eggs, fats, fresh fruit, other fruit and preserves, vegetables, potatoes, sweets and spices, non-alcoholic beverages, alcoholic beverages;
- the major group "Non-food goods" includes cigarettes, fabrics, clothing, knitting, footwear, furniture, means of transport and auto parts, printed publications, fuels and fuels, other goods;
- the major group "Services" includes education and training, communal-housing services, public food, health, car repair services, transport services, other services.
3 Starting from January 2024, the CPI calculations are made using the weighting coefficients calculated on the basis of the data for the year 2022.
- Elizaveta TodicăHead of Division
Consumer Price Statistics Division
- Report a mistake. Select the desired text and press CTRL + ENTER