

Final results of the Population and Housing Census 2024: Educational Characteristics of the Population1
The National Bureau of Statistics presents the final results of the 2024 Population and Housing Census (RPL) on the educational characteristics of the usually resident2 population as of the census reference date (8 April 2024).
According to the final results of the 2024 LPL compared to the 2014 census:
- The share of persons with completed higher education accounted 19.1% of the total population aged 10 years and over, an increase of 4.2 percentage points (p.p.) compared to the 2014 PHC;
- The share of persons continuing their studies accounted 20.6% of the total population aged 7 years and over, an increase of 1.2 p.p. compared to the 2024 PHC;
- The literacy rate of the population aged 10 years and over was 99.6%, an increase of 0.1 percentage points compared to the 2014 PHC. Population structure by highest level of education completed.
Structure of the population by highest level of completed education
The results of the 2024 census indicate a positive trend in the evolution of the highest level of completed education among the population aged 10 years and over, with an increase of 65.8 thousand persons with higher education between 2014 and 2024 (Table 4.1 in the Annex).
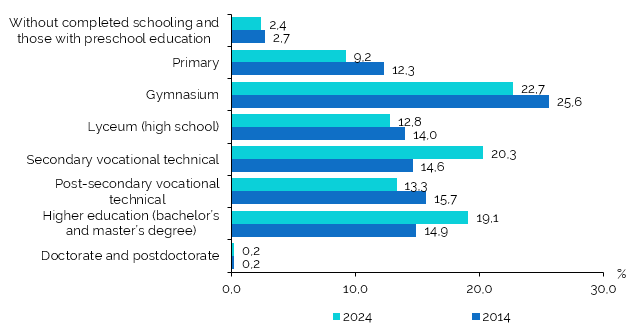
Thus, out of the total population aged 10 years and over, amounting 2 107.4 thousand persons, at the reference date of the 2024 census, 19.1% had higher education, which includes cycle I (bachelor), cycle II (master), or their equivalent, an increase of 4.2 p.p. compared to the 2014 census (14.9%) (Figure1, Table 4.1 of the Annex). Within the reference population, the majority had vocational-technical education (secondary and post-secondary) – 33.6%, compared to 30.3% recorded in the 2014 census.
The distribution of the population across other levels of completed education recorded lower shares compared to the 2014 census and included: 12.8% with completed lyceum (high school) education (14.0% in the 2014 census), 22.7% with completed gymnasium education (25.6%), 9.2% with primary education (12.3%), and 2.4% without completed schooling and those with preschool education (2.7%) (Figure 1).
Figure 1. Distribution of the population aged 10 years and over according to the highest level
of completed education (or equivalent), in the 2024 and 2014 censuses, %
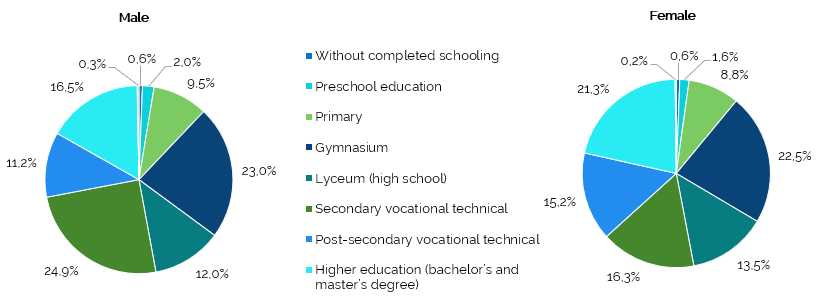
With regard to the sex structure, which overall for the population aged 10 years and over is 46.6% male and 53.4% female, the female population predominated at the level of post-secondary vocational-technical education (60.8%) and higher vocational education and training (bachelor and master - 59.6%) while the male population predominated only at the level of secondary vocational – technical education (57.1%). At the level of doctoral and postdoctoral education, the shares were equal for both sexes (Table4.2 of the Annex).
The distribution of men/women by the highest level of completed education (or equivalent) shows that the share of men with secondary vocational - technical education was 8.6 pp higher than the share of women (24.9% compared to 16.3%), while the share of women with lyceum (high school) education (13.5%), post-secondary vocational - technical education (15.2%) and higher education (bachelor and master) (21.3%) prevailed compared to the share of men with the same level of education (12%, 11.2% and 16.5%, respectively) (Figure2).
Figure 2. Distribution by sex of the population aged 10 years and over by highest level
of completed education, in the 2024 census, %
In the distribution of the population aged 10 and over by highest level of completed education and by area of residence, 46.1% of this population lived in urban areas and 53.9% in rural areas. According to the highest level of education completed, the data show that the rural population predominated among those who completed primary education (59.6%), secondary - gymnasium (70.3%), high – school (58.1%) and secondary vocational technical education (60.2%), while the urban population was more numerous among those with post-secondary vocational-technical education (52.3%), higher education (Bachelor’s and Master’s – 73.2%), and doctoral/postdoctoral education (87.4%) (Table 4.2 in the Annex).
The distribution by levels of completed education indicates that about one third (29.7%) of the rural population aged 10 and over had completed gymnasium education and more than one fifth (22.7%) had completed secondary vocational technical education, while in urban areas about one third (30.3%) of the population had completed higher education (bachelor and master) and every sixth (17.5%) had completed secondary vocational -technical education (Table4.3 of the Annex).
Compared to the 2014 census, the share of the urban population aged 10 and over with completed higher education increased (by 3.5 p.p.) as well as those with completed secondary vocational technical education (by 6.7 p.p.), but there was a decrease in the level of completed post-secondary vocational technical education (by 6.7 p.p.). In rural areas, the share of the population aged 10 and over with completed secondary vocational education and training increased (by 6 p.p.).
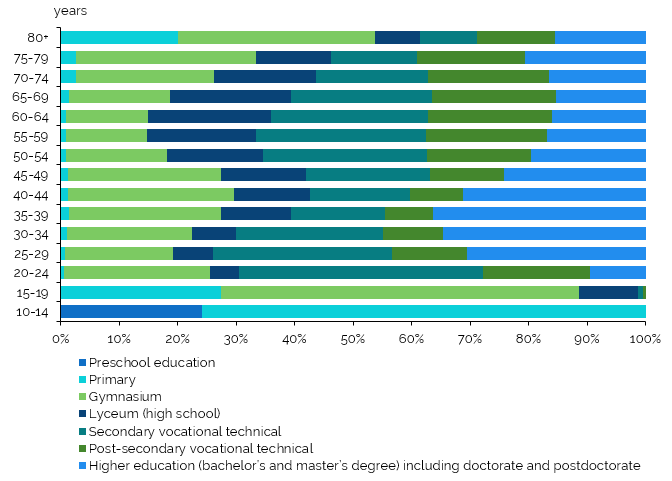
In the distribution by age group of the population aged 10 years and over who had completed an educational, and according to the highest level of education. census data show that over one third of the population in the 30-34 and 35-39 age groups had completed higher level of education (34.7% and 36.3%, respectively). Every fifth person in the age groups 55-59 (or 20.7%), 60-64 years (21.3%), 65-69 years (21.1%), as well as 70-74 years (20.7%) had completed post-secondary vocational technical education, while every fourth person in the age groups 30-34 (or 25.2%), 60-64 (26.9%) and 65-69 years (24.2%) as well as about 30 percent of age groups 50-54 (28.0%), 55-59 (29.2%) had completed secondary vocational technical education. With regard to young people aged between 24 and 29, 41 percent of the 20-24 age group had secondary vocational technical education and 30 percent of the 25-29 age group (30.5 percent) had secondary and higher technical education. At the same time, virtually every third person in the 75-79 age group and those aged 80 and over (or 30.8% and 33.7% respectively) had completed secondary education (Figure3).
Figure 3. Distribution by age group of the population aged 10 years and over who had completed
an educational level, at the 2024 census, %
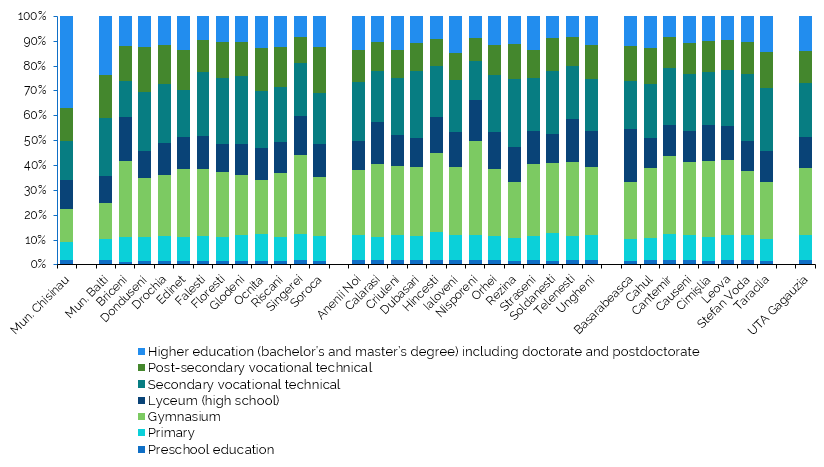
In the territorial distribution of the population by the highest level of completed education among persons aged 10 years and over who had completed an educational level, the highest share of persons with higher education (including doctoral and postdoctoral studies) is observed in the municipality of Chisinau - 36.7%, followed by Balti municipality of with 23.5% (Figure4, Table 4.9 of the Annex). In most districts, the share of the population with completed higher education ranges between 10 and 15%, while the lowest values are recorded in Sangerei (8.1%), Telenesti and Cantemir (8.3% each). No major territorial discrepancies are observed at the other educational levels.
Figure 4. Territorial distribution (by Chisinau mun., ATU Gagauzia, districts/municipalities) of the population
aged 10-years and over who had completed an educational level, at the 2024 census, %
Structure of the population continuing the studies
At the reference date of the 2024 census, 455.0 thousand people aged 7 years and over continued their studies, representing 20.6% of the total population aged 7 years and over. Of these, 229.4 thousand people were from urban areas (50.4%) and 225.6 thousand people were from rural areas (49.6%). The distribution of those continuing their studies by age groups was as follows: 135.4 thousand persons aged 7-10 years (29.7% of all those who continue their studies), 159.5 thousand persons aged 11-15 years (35.1%), 77.6 thousand persons aged 16-18 years (17.0%), 58.5 thousand persons aged 19-23 years (12.9%) and 24 thousand persons aged 24 and over (5.3%) (Figure5, Table 4.10 of the Annex).
Figure 5. Structure of the population aged 7 years and over, continuing studies,
by age groups, in the 2024 and 2014 censuses, %
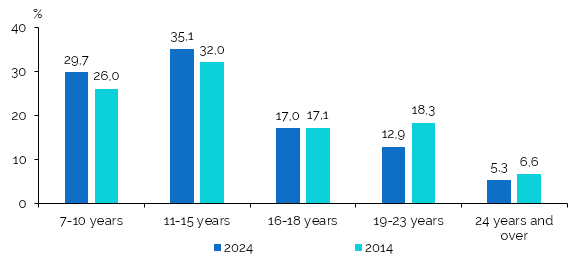
Compared to the 2014 census, the share of persons aged 7–15 years who were continuing their studies increased by 6.8 percentage points, while the share of persons aged over 18 years decreased.
A slight predominance of the females by 50.5% (compared to 49.5% of males) was observed in the sex structure of those continuing their studies (see Table 4.10 in the Annex).
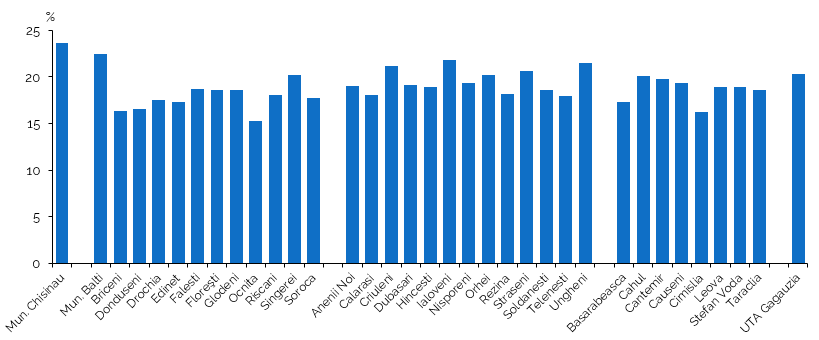
At the territorial level, the highest shares of persons aged 7 and over who were continuing their studies at the reference date of the 2024 census were registered in the Chisinau municipality of (23.7%) and Balti (22.4%), while the lowest districts of Ocnita (15.3%), Cimislia (16.2%) and Briceni (16.3%) (Figure 6 and Table 4.12 of the Annex).
Figure 6. Share of persons continuing their studies, out of the total population aged 7 years and over,
in territorial profile (mun. Chisinau, ATU Gagauzia, districts/municipalities), at the 2024 census, %
Population structure by literacy level
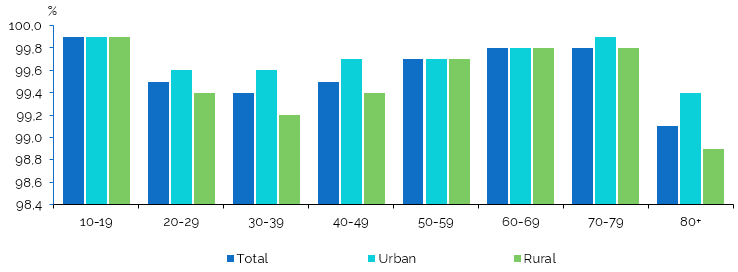
The literacy rate of the population at the 2024 census was 99.6% of the total population aged 10 and over, with an increase by 0.1 p.p. compared to the 2014 census. By age group structure, the lowest proportion of literate population (99.1%) is in the age group of 80 years and older, for which the highest proportion of illiterate people (0.9%) was recorded, respectively (Figure7, Table 4.13 in the Annex).
Figure 7. Literacy rate of the population aged 10 and over, by age group and area of residence,
in the 2024 census, %
The population who declared that they could not read or write (literate) at the 2024 census is 7.5 thousand people or 0.4% of the population aged 10 years and over. Relative to the residence environment, 63.7% of the illiterate population was in rural areas and, relative to the sex structure, 50.6% of the persons unable to read or write were female (Table4.14 of the Annex). The number and share of the illiterate population decreased compared to previous censuses, from 1.1% in 2004, 0.5% in 2014 - to 0.4% in 2024.
Annexes:
Notes:
1 The information is presented for the territory where the census was actually conducted within the framework of the 2024 PHC, i.e. excluding the administrative-territorial units on the left bank of the Nistru River, the municipality of Bender (including the village of Proteagailovca), Chitcani commune (including the villages of Mirenești and Zahorna), the villages of Cremenciug and Gasca in Causeni district, Corjova commune (including the village of Mahala) in Dubăsari district, as well as the village of Roghi within Molovata Noua commune, Dubasari district.
2 The usually resident population (the ”resident”population or URP) – represents the population that has lived predominantly in the country in the last 12 months prior to 08.04.2024 (the reference date of the census), regardless of temporary absences for the purpose of rest, vacation, visits to relatives and friends, business, medical treatment, or religious pilgrimages (Article 4 of Law 231/2022 on the population and housing census).
3 Marital status refers to the population aged 15 years and over.
Methodological notes:
The Population and Housing Census (PHC) is a complex statistical survey, whose primary objective is to produce official statistics on population and housing, comparable at the international level.
The 2024 PHC was conducted in accordance with national legislation, taking into account international recommendations, thus ensuring worldwide and regional comparability (including the recommendations for population and housing censuses of the United Nations (UN), the Conference of European Statisticians for the 2020 round of population and housing censuses, Regulation (EC) No. 763/2008 of the European Parliament and of the Council, etc.).
The reference time for the 2024 Population and Housing Census was 00:00 on April 8, 2024.
Within the framework of 2024 PHC, in order to ensure the completeness/coverage and accuracy of the data, a series of new methods and techniques were applied, compared to previous censuses, such as:
- Enumeration by interviewing persons at their usual place of residence using tablets (CAPI) and recording the declared responses through an electronic application. The use of digital technologies significantly improved the quality of the collected data, contributed to ensuring confidentiality, and accelerated the interview process.
- Collection of the personal state identification number (IDNP) within the 2024 PHC allowed the combination and integration, for the purpose of producing official census statistics, of personal data collected directly from respondents and data collected indirectly from administrative sources and private data sources..
- The census period was extended to three months, compared to the previous PHC, which was limited to 14 days.
- Enumerators carried out at least five households visits in cases where there was no contact with the household.
- The diversification of census methods and techniques and the facilitation of participation contributed to improving population coverage in the 2024 PHC, including:
- Notification of the date of repeat visits by the enumerators
- Facilitating self-enumeration through online form completion on the NBS website;
- Operation of the PHC green line for interaction with the population
- Data collection in electronic format, through interviews assisted by electronic devices (CATI) or via the Internet (CAWI – for the enumeration of diplomatic and consular staff);
- Functioning of fixed census points during the last week of enumeration, offering the possibility for persons not yet covered to be enumerated at the premises of NBS territorial offices, etc
- Conducting the Post-Enumeration Survey (PRS) for the Republic of Moldova at the level of development regions, urban/rural areas, sex, and major age groups (in 2014, the PES was conducted only for Chisinau municipality) – for the evaluation of undercoverage in the PHC.
- Study for assessing the overcoverage of the PHC
- Use of administrative data sources (ADS) and the “signs of life” method to supplement data collected in the field and to estimate the total population of the country (including those not covered by the PHC).
Basic concepts:
The highest level of completed education represents the final stage of formal education and indicates the academic and professional training acquired by a person, from preschool education to doctoral studies. The levels of education are presented in accordance with the structure of the education system from the Education Code (or the equivalent for similar educational pathways in the country or abroad):
- Preschool education;
- Primary education;
- Lower secondary education (gymnasium);
- Upper secondary education (lyceum/high school);
- Secondary vocational technical education;
- Post-secondary vocational technical education;
- Higher education, cycle I: bachelor’s degree;
- Higher education, cycle II: master’s degree;
- Higher education, cycle III: doctoral degree.
The literacy rate is defined as the percentage of the population in a given age group who can read and write.
Illiteracy is defined as the inability to read and write, with understanding, a simple statement related to everyday life.
Relevant information:
- Dorin LozovanuHead of Division
Census Division
- Report a mistake. Select the desired text and press CTRL + ENTER